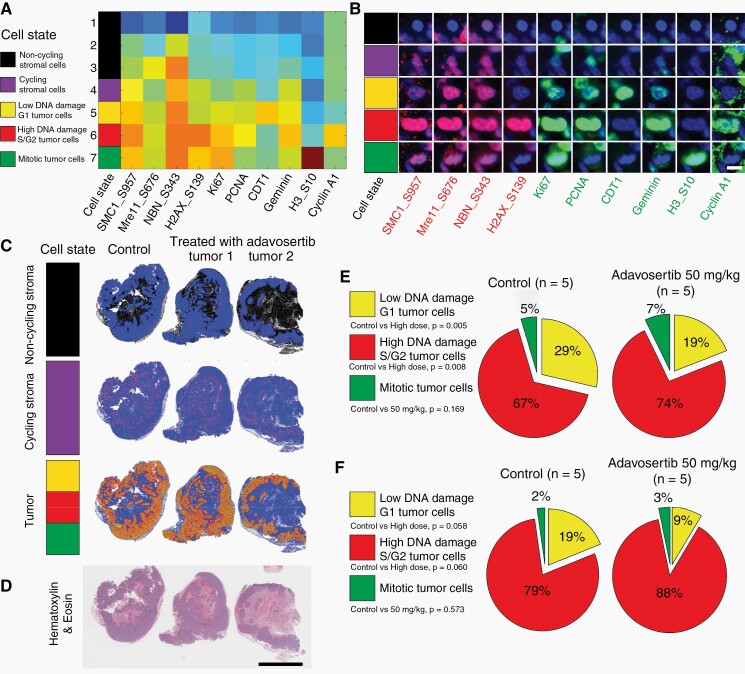
Fig. 5.
Effects of adavosertib treatment in GBM-derived lines characterized by t-CyCIF technique. (a) Heatmap of each cell state (clusters) using k-means clustering from all cells in FFPE section from GBM22 derived PDX line batch 1 (control, n = 1; adavosertib high dose, 50 mg/kg, n = 2) using 4 DNA damage related markers (SMC1_S957, Mre11_S676, NBN_S343, and H2AX_S139) and 6 cell cycle related markers (Ki67, PCNA, CDT1, Geminin, H3_S10, and Cyclin A1) (Heatmap: red—high expression; blue—low expression). All cells were clustered into the following cell states: non-cycling stromal cells (black, Ki67-negative/PCNA-negative, cluster 1–3); Cycling stromal cells (purple, Ki67 low/PCNA low/DNA damage low, cluster 4); Low DNA damage G1 tumor cells (yellow, CDT1 high/Ki67 low/PCNA low/DNA damage low, cluster 5); High DNA damage S/G2 tumor cells (red, Geminin high/PCNA high/CDT1 low/DNA damage high, cluster 6); Mitotic tumor cells (green, pH3 high/Ki67 high/PCNA low, cluster 7). (b) Representative cells for each cell state in the FFPE section from GBM22-derived PDX line batch 1 (scale bar: 10 µm). (c) Dot plots showed the distribution of each cell state (non-cycling stroma, cycling stroma and tumor) in FFPE section from GBM22-derived PDX line batch 1 (control, n = 1; adavosertib high dose, 50 mg/kg, n = 2). (d) The H&E image from adjacent FFPE section showed the tumor region (scale bar: 5000 µm). (e) The percentage of tumor cells of each cell cycle phase to all tumor cells was calculated and presented as a pie chart for frozen sections from GBM22 derived PDX line batch 2 (control, n = 5; adavosertib high dose, 50 mg/kg, n = 5). (f) GBM84 derived PDX line (control, n = 5; adavosertib high dose, 50 mg/kg, n = 5). Detailed information for individual PDX is listed in Supplementary Table S4. Abbreviations: GBM, glioblastoma; FFPE, formalin-fixed paraffin-embedded; PDX, patient-derived xenograft, FFPE, PDX.

