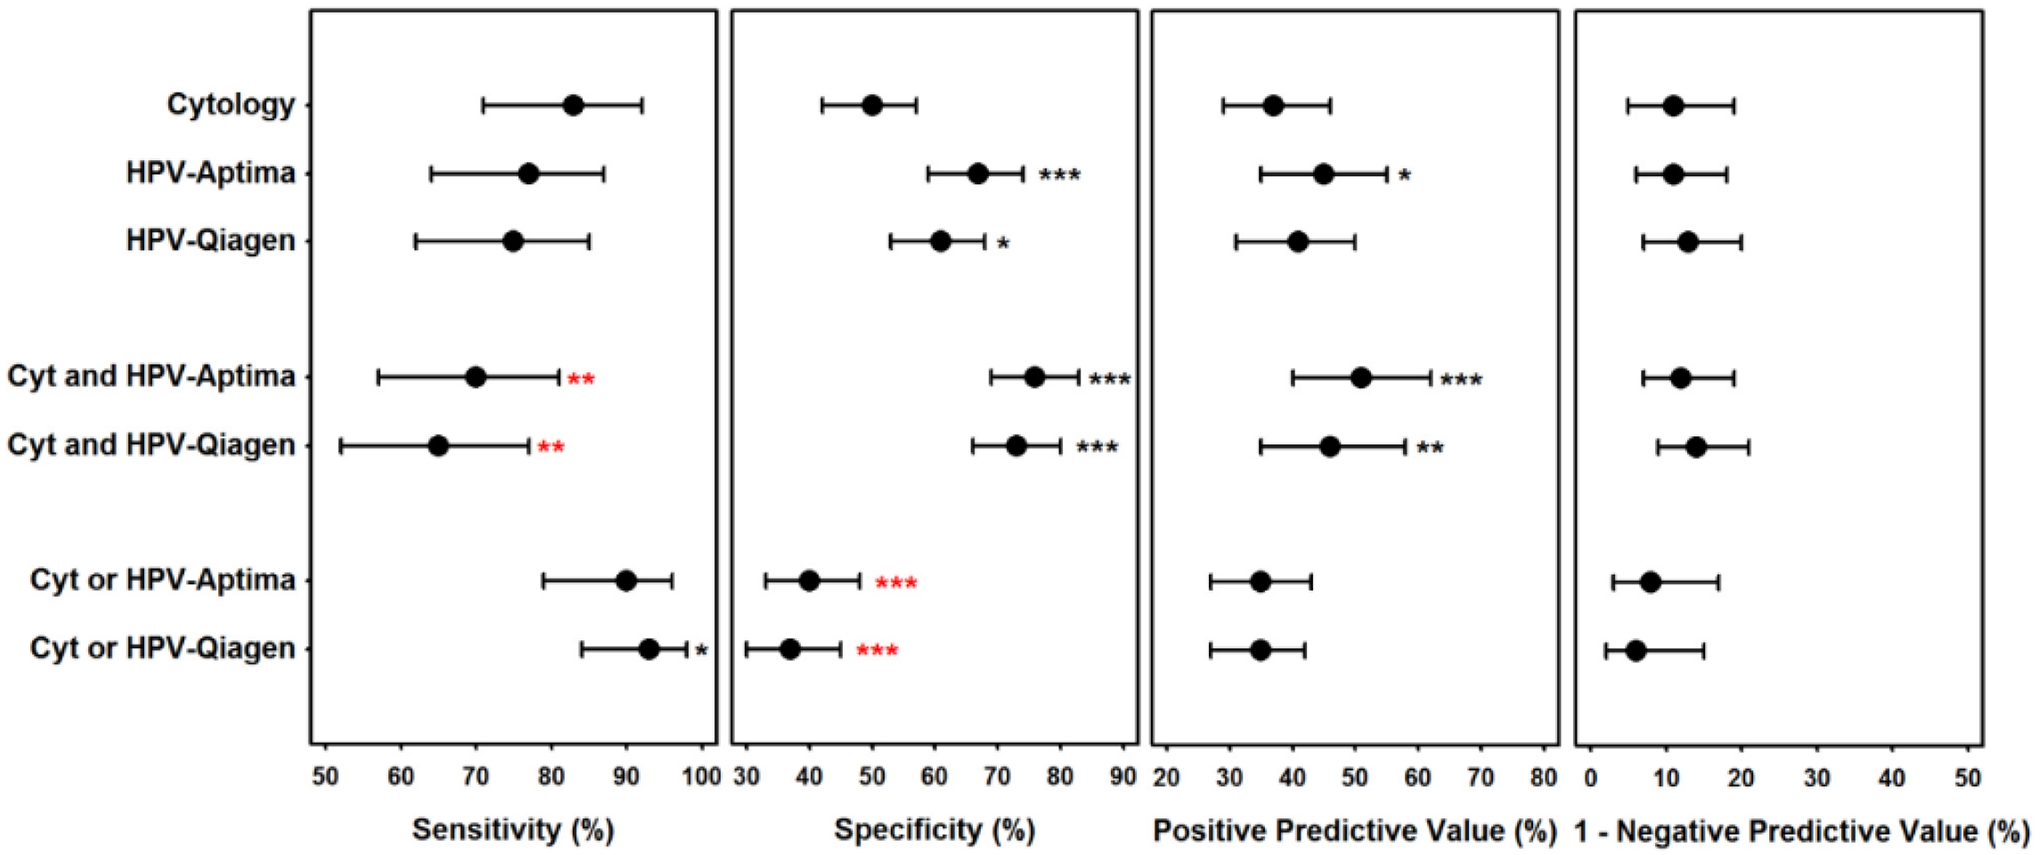
Figure 2:

Test Characteristics for Performance of Cytology, HPV-Aptima, and HPV-Qiagen for Predicting hHSIL in 229 WLHIV.
Paired comparisons to corresponding cytology test characteristic p-value: * 0.01–0.05, ** 0.001-<0.01, *** <0.001; red indicates significantly worse than cytology. Dot represent test characteristic estimate and error bars represent exact binomial confidence intervals.
