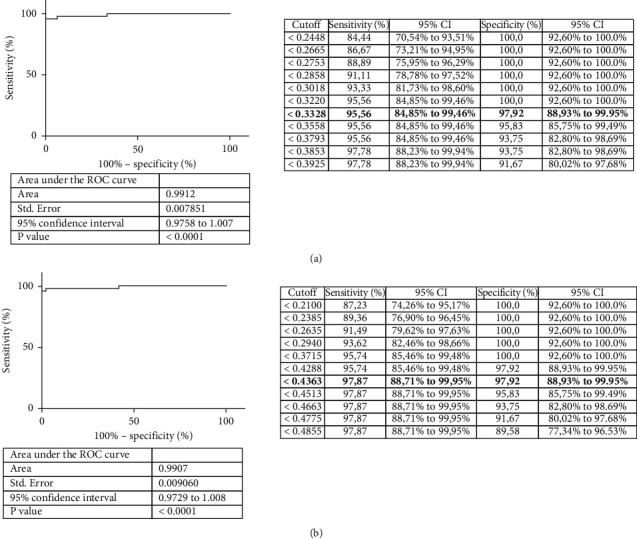
Figure 2.

Diagnostic validation of polyprotein ELISA. (a) ROC curve analysis using the polyprotein (a) and PPA (b) as antigens and carried out with 95 sera samples, which were classified as positive or negative according to their previous result in mycobacterium isolation in culture from feces with subsequent IS900 PCR amplification. The right panels display a list of the different possible cut-off points with their respective sensitivities and specificities. The chosen cut-off points with their corresponding sensitivity and specificity are indicated in bold.
