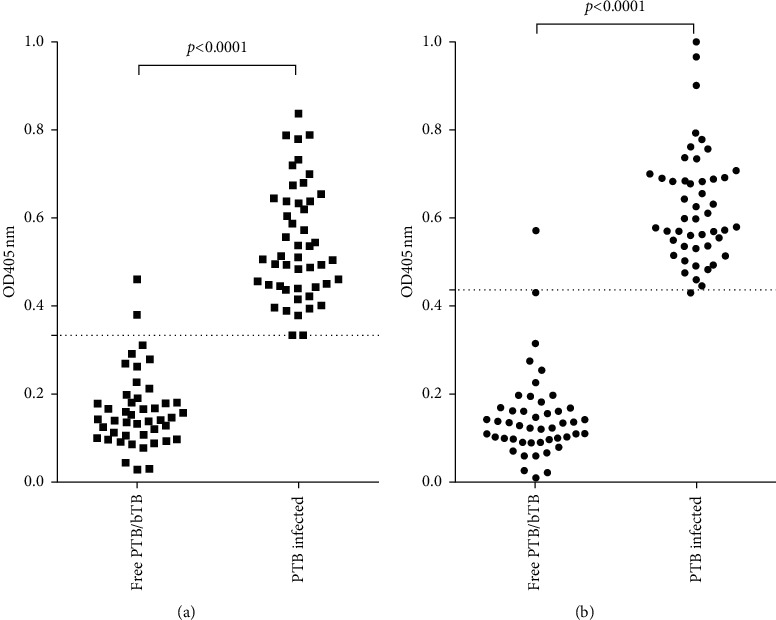
Figure 3.

Evaluation of the ELISA developed using polyprotein as antigen and comparison with PPA-ELISA. Corrected OD at 405 nm (OD405nm sample minus OD405nm buffer) obtained by the polyprotein-ELISA (a) and PPA-ELISA (b) of the 95 evaluated sera (47 sera from healthy bovines and 48 sera from MAP-infected bovines) for the diagnostic validation of the technique. The dashed line indicates the cut-off point selected by the analysis of ROC curves for each ELISA. Wilcoxon analysis showed significant differences between the PTB-free and PTB-infected groups (P < 0.0001).
