

Abstract
Background
The combination of plasma fibrinogen and neutrophil to lymphocyte ratio (F-NLR) score is a novel inflammatory marker constituted by peripheral blood fibrinogen concentration and neutrophil to lymphocyte ratio. In the current study, we aim to explore the relationship between admission F-NLR score and intracerebral hemorrhage (ICH) and assess its prognostic predictive ability in ICH patients.
Methods
The original cohort was consecutively recruited from August 2014 to September 2017, and the validation cohort was consecutively recruited between October 2018 and March 2020. The primary outcomes were 3-month functional outcome and 1-month mortality. All statistical analyses were performed using SPSS and R software.
Results
A total of 431 and 251 ICH patients were included in original cohort and validation cohort, respectively. In the original cohort, F-NLR score could independently predict the 3-month functional outcome (adjusted OR 2.013, 95% CI 1.316-3.078, p = 0.001) and 1-month mortality (adjusted OR 3.036, 95% CI 1.965-4.693, p < 0.001). Receiver operation characteristic (ROC) analyses and predictive model comparison indicated that F-NLR score had a stronger predictive ability in the 3-month outcome and 1-month mortality. Validation cohort verified the results.
Conclusion
F-NLR score was an independent indicator for both the 3-month functional outcome and 1-month mortality, and its prognostic predictive ability was superior to fibrinogen and NLR in both the original and the validation cohort.
1. Introduction
Nontraumatic spontaneous intracerebral hemorrhage (ICH) is the most common type of intracranial hemorrhage and isolated intraventricular hemorrhage, which accounts for 10-15% of stroke in western populations and 18-20% in Asian populations. [1, 2] ICH results from bleeding into the brain parenchymal arising from the rupture of small penetrating arteries which causes neurological deficits and death. [2]
It is well appreciated that inflammation begins immediately after the formation of hematoma and that it plays a role in ICH-induced secondary brain injury. [3, 4] Recruitment and infiltration of inflammatory cells including monocytes, macrophages, neutrophils, and lymphocytes boost local cytokines, chemokines, and adhesion molecules. [5] Accompanied with the breakdown of the blood-brain barrier (BBB), systemic inflammation also occurred. Therefore, peripheral blood inflammatory markers might also reflect the severity and progression of intracranial lesions. Studies established that neutrophil to lymphocyte ratio (NLR) was a prognostic indicator for ICH, in both early functional outcome and mortality. [6] Moreover, indexes such as monocyte, fibrinogen, albumin, C-reactive protein (CRP), and platelet to lymphocyte ratio (PLR) were also reported to be associated with the outcomes of ICH. [7–11]
The F-NLR score is a novel inflammatory marker constituted by peripheral blood fibrinogen concentration and NLR. This combined index was widely used in oncology studies and proved to have prognostic significance in various cancers including non-small cell lung cancer, atypical meningioma, and esophageal squamous cell carcinoma. [12–14] However, the evaluation of F-NLR score on spontaneous ICH was not well identified. In this study, we explored the relationship between admission F-NLR score and ICH and assessed its prognostic predictive ability in ICH patients.
2. Methods
2.1. Study Design
This current retrospective study was conducted built upon the prospectively collected database of ICH patients at the Department of Neurosurgery affiliated to West China Hospital, Sichuan University. The original cohort was consecutively recruited from August 2014 to September 2017. The validation cohort was built to verify the results from the original cohort, who were consecutively recruited patients between October 2018 and March 2020. All the patients from current cohorts were managed based on the standard guidelines for stroke. [15, 16] The baseline clinical data of the included patients were retrieved from an electronic medical record system of West China Hospital.
The inclusion criteria for screening patients included the following: (1) older than 18 years; (2) intact baseline clinical data; (3) intact imaging data including initial computed tomography (CT) at admission and computed tomography angiography (CTA); and (4) completed the follow-up. The exclusion criteria included the following: (1) younger than 18 years; (2) incomplete baseline clinical data; (3) intracerebral hemorrhage caused by head trauma, tumor, aneurysm, arteriovenous malformation, ischemic stroke, and other obvious causes; (4) absence of CTA; (5) history of infectious diseases or diagnosed with infections within 48 hours from admission, malignancies, rheumatic diseases, blood system diseases, or other diseases which evidently affect peripheral blood cells; and (6) lost to follow-up.
2.2. Clinical Parameters Assessment
Clinical variables were retrieved from the electronic medical record system we mentioned previously. [17] The included clinical data were listed as follows: (1) demographics: age at onset, gender; (2) admission conditions: Glasgow Coma Scale (GCS), admission systolic blood pressure (SBP), diastolic blood pressure (DBP), and time from onset to CT; (3) medical history: history of hypertension, diabetes mellitus, smoking, alcohol abuse, presence of stroke, and history of receiving antiplatelet medication; (4) ICH imaging characteristics: hematoma volume, location of hematoma, presence of intraventricular hemorrhage (IVH), and hematoma expansion (HE); (5) treatment method; and (6) routine blood test. Of note, the majority of the blood samplings were conducted when patients were diagnosed with ICH, usually after an initial CT scan.
NLR was defined as neutrophil count/lymphocyte count. Plasma fibrinogen concentration and NLR were divided into high and low groups based on the best cutoff values calculated by the receiver operating characteristic (ROC) curve. F-NLR score was defined as follows: score 0: low fibrinogen and low NLR; score 1: low fibrinogen and high NLR or high fibrinogen and low NLR; and score 2: high fibrinogen and high NLR.
The included patients were followed up every 1 month after admission. The primary outcomes were 3-month functional outcome and 1-month mortality. The modified Rankin Scale (mRS) was applied to assess the patients' functional outcome. mRS score 0-2 was defined as good outcome, and mRS score 3-6 as poor outcome. Intracranial parenchymal hematoma volume was calculated on the admission CT scans by using 3D Slicer (http://www.slicer.org) with manual segmentation. Two independent neurosurgeons were responsible for calculating hematoma volume, and a neuroradiologist was invited to advise in complex cases. Hematoma expansion was defined as hematoma enlargement ≥ 6 mL or ≥33% from admission. [18] Surgical interventions mainly consisted of hematoma evacuation with craniotomy, external ventricular drainage, and decompressive craniectomy.
2.3. Statistical Analysis
All statistical analysis was performed using SPSS software (Version 22.0, IBM Co., Armonk, NY, USA) and R software (Version 3.6.1). Continuous variables were displayed as mean ± standard deviation (SD) or median with interquartile range (IQR), and categorical variables were presented as frequency and percentage. A Kolmogorov–Smirnov test was applied to check whether the data conforms to the normal distribution. Continuous variables which conformed to the normal distribution were compared using student's t-test, otherwise Mann-Whitney U test or Kruskal-Wallis test. Categorical variables were compared using the χ2 or Fisher's exact test. The multivariate logistic regression analyses were used to confirm the independent risk factors for primary outcomes in ICH patients, and variables with p < 0.1 in a univariate analysis were included into backward stepwise multivariate logistic regression. ROC analyses were conducted to determine the optimal cutoff values for fibrinogen concentration and NLR by calculating maximal Youden index (Youden index = sensitivity + specificity–1) and assess the predictive accuracy of fibrinogen, NLR, and F-NLR score for outcomes. Area under the curves (AUCs) were compared by using DeLong's test. Harrell's concordance index (C-index) and Akaike information criterion (AIC) were used to evaluated the predictive models; higher C-index indicated better predictive accuracy, while lower AICs indicated superior model-fitting. [19, 20] A two-sided p < 0.05 was considered as statistically significant.
2.4. Ethics
This study was approved by the Ethical Committee of Sichuan University (No. 2013NO52) and conducted based on the principles announced in the Declaration of Helsinki. All patients and their authorized trustees were fully informed and signed consent to use their data for research.
3. Results
3.1. Baseline Clinical Characteristics
After screening, a total of 431 and 251 ICH patients were included in original cohort and validation cohort, respectively, (Figure 1). The optimal cutoff values of fibrinogen and NLR were 2.76 g/L and 10.04, respectively, in the original cohort and 2.82 g/L and 9.32, respectively, in the validation cohort by calculating the maximal Youden index through the ROC curve in the original cohort.
Figure 1.

Flow chart of the current study. Abbreviation: ICH, intracerebral hemorrhage; CT, computed tomography; CTA, computed tomography angiography.
Baseline clinical characteristics of the original cohort are depicted in Table 1. There were 327 patients had poor outcome and 104 patients had good outcome after 3-month follow-up. As regard to 1-month mortality, 80 patients died within 30 days after admission while 351 survived. 164 (38.1%) patients had a F-NLR score 0, 183 (42.5%) had a score 1, and 84 (19.5%) had a score 2. GCS score (p < 0.001), smoking (p = 0.042), hematoma volume (p < 0.001), hematoma location (p < 0.001), IVH (p < 0.001), HE (p = 0.004), treatment method (p < 0.001), NLR (p = 0.001), fibrinogen (p < 0.001), and F-NLR score (p < 0.001) were significantly related to 3-month functional outcome. Lower GCS score (p < 0.001), larger hematoma volume (p < 0.001), presence of IVH (p < 0.001), undergoing surgical intervention (p = 0.013), higher NLR (p < 0.001), fibrinogen (p < 0.001), and F-NLR score (p < 0.001) associated with a higher proportion of death.
Table 1.
Baseline clinical characteristics of patients with spontaneous ICH in original cohort.
| Clinical variables | Total (n = 431) | 3-month functional outcome | 1-month mortality | ||||
|---|---|---|---|---|---|---|---|
| Poor outcome (n = 327) | Good outcome (n = 104) | p value | Death (n = 80) | Survival (n = 351) | p value | ||
| Age (year) | 58.76 ± 12.92 | 59.09 ± 13.10 | 57.72 ± 12.34 | 0.557 | 58.88 ± 13.77 | 58.74 ± 12.74 | 0.981 |
| Male | 299 (69.4) | 227 (69.4) | 72 (69.2) | 0.971 | 53 (66.3) | 246 (70.1) | 0.502 |
| GCS | 13 (8,15) | 12 (7,14) | 15 (14,15) | <0.001 | 8 (6,11) | 13 (10,15) | <0.001 |
| Admission SBP (mmHg) | 167.72 ± 28.65 | 168.77 ± 29.76 | 164.42 ± 24.68 | 0.117 | 164.30 ± 31.79 | 168.50 ± 27.88 | 0.498 |
| Admission DBP (mmHg) | 98.10 ± 17.94 | 98.08 ± 18.46 | 98.16 ± 16.31 | 0.723 | 95.04 ± 19.41 | 98.79 ± 17.55 | 0.114 |
| Onset to CT (hours) | 6 (4,12) | 6 (4,10) | 7 (4,20) | 0.020 | 5 (4,9) | 6 (4,13) | 0.262 |
| History of hypertension | 245 (56.8) | 188 (57.5) | 57 (54.8) | 0.630 | 46 (57.5) | 199 (56.7) | 0.896 |
| History of diabetes mellitus | 31 (7.2) | 28 (8.6) | 3 (2.9) | 0.051 | 3 (3.8) | 28 (8.0) | 0.187 |
| Smoking | 143 (33.2) | 117 (35.8) | 26 (25.0) | 0.042 | 23 (28.7) | 120 (34.2) | 0.351 |
| Previous stroke | 22 (5.1) | 19 (5.8) | 3 (2.9) | 0.238 | 2 (2.5) | 20 (5.7) | 0.373 |
| Antiplatelet or anticoagulation | 20 (4.6) | 14 (4.3) | 6 (5.8) | 0.718 | 5 (6.3) | 15 (4.3) | 0.643 |
| Hematoma volume (mL) | 20.30 (7.81,35.78) | 25.16 (9.06,40.42) | 9.25 (2.64,21.70) | <0.001 | 28.69 (10.72,49.69) | 17.69 (7.05,32.94) | <0.001 |
| Hematoma location | |||||||
| Supratentorial | 358 (83.1) | 284 (86.9) | 74 (71.2) | <0.001 | 66 (82.5) | 292 (83.2) | 0.882 |
| Infratentorial | 73 (16.9) | 43 (13.1) | 30 (28.8) | 14 (17.5) | 59 (16.8) | ||
| Presence of IVH | 170 (39.4) | 147 (45.0) | 23 (22.1) | <0.001 | 57 (71.3) | 113 (32.2) | <0.001 |
| Presence of HE | 104 (24.1) | 90 (27.5) | 14 (13.5) | 0.004 | 25 (31.3) | 79 (22.5) | 0.099 |
| Treatment | |||||||
| Surgical intervention | 114 (26.5) | 107 (32.7) | 7 (6.7) | <0.001 | 30 (37.5) | 84 (23.9) | 0.013 |
| Conservative treatment | 317 (73.5) | 220 (67.3) | 97 (93.3) | 50 (62.5) | 267 (76.1) | ||
| PLT (10ˆ9/L) | 151 (115,199) | 151 (114,198) | 150 (120,205) | 0.824 | 143 (112,199) | 151 (116,201) | 0.374 |
| PT (s) | 11.4 (10.9,12.3) | 11.4 (10.9,12.3) | 11.6 (10.9,12.3) | 0.482 | 11.8 (10.9,13.0) | 11.4 (10.9,12.1) | 0.075 |
| APTT (s) | 26.5 (23.7,29.7) | 26.5 (23.7,29.4) | 26.6 (23.8,30.3) | 0.811 | 26.5 (23.5,30.1) | 26.6 (23.8,29.5) | 0.974 |
| INR | 0.99 (0.93-1.06) | 0.98 (0.93,1.05) | 1.00 (0.94,1.06) | 0.153 | 1.00 (0.93,1.10) | 0.98 (0.93,1.04) | 0.066 |
| NLR | 8.18 (4.81,13.20) | 8.77 (5.14,13.88) | 6.44 (4.25,10.49) | 0.001 | 12.53 (7.99,19.48) | 7.35 (4.32,11.98) | <0.001 |
| Fibrinogen | 2.76 (2.29,3.38) | 2.92 (2.37,3.54) | 2.44 (2.20,2.97) | <0.001 | 3.34 (2.87,4.47) | 2.65 (2.23,3.23) | <0.001 |
| F-NLR score | |||||||
| 0 | 164 (38.1) | 102 (31.2) | 62 (59.6) | <0.001 | 7 (8.8) | 157 (44.7) | <0.001 |
| 1 | 183 (42.5) | 149 (45.6) | 34 (32.7) | 40 (50.0) | 143 (40.7) | ||
| 2 | 84 (19.5) | 76 (23.2) | 8 (7.7) | 33 (41.3) | 51 (14.5) | ||
Data are expressed as n (%), mean ± SD, or median (25th, 75th quartile). Abbreviation: ICH, intracerebral hemorrhage; SD, standard deviation; GCS, Glasgow Coma Scale; SBP, systolic blood pressure; DBP, diastolic blood pressure; IVH, intraventricular hemorrhage; HE, hematoma expansion; PLT, platelet; PT, prothrombin time; APTT, activated partial thromboplastin time; INR, international normalized ratio; F, fibrinogen; NLR, neutrophil to lymphocyte ratio.
The optimal cutoff values of fibrinogen concentration and NLR were applied for validation cohort in primary outcomes. As shown in Table 2, validation cohort consisted of 179 patients with poor 3-month functional outcome and 72 with good outcome. Meanwhile, 37 patients died within 1 month. Patients with F-NLR score 0, 1, 2 were 111 (44.2%), 87 (34.7%), 53 (21.1%), respectively. GCS score (p < 0.001), hematoma volume (p < 0.001), hematoma location (p < 0.001), presence of IVH (p < 0.001), treatment method (p < 0.001), NLR (p = 0.001), fibrinogen (p < 0.001), and F-NLR score (p < 0.001) were evidently associated with 3-month functional outcome. As for 1-month mortality in validation cohort, GCS (p < 0.001), hematoma volume (p < 0.001), presence of IVH (p < 0.001) and HE (p = 0.002), platelet count (PLT) (p = 0.036), prothrombin time (PT) (p = 0.006), international normalized ratio (INR) (p = 0.018), NLR (p < 0.001), fibrinogen (p < 0.001), and F-NLR score (p < 0.001) were risk factors in univariate analysis.
Table 2.
Baseline clinical characteristics of patients with spontaneous ICH in validation cohort.
| Clinical variables | Total (n = 251) | 3-month functional outcome | 1-month mortality | ||||
|---|---|---|---|---|---|---|---|
| Poor outcome (n = 179) | Good outcome (n = 72) | p value | Death (n = 37) | Survival (n = 214) | p value | ||
| Age (year) | 59.21 ± 13.57 | 59.88 ± 13.78 | 57.56 ± 13.00 | 0.561 | 58.76 ± 14.16 | 59.29 ± 13.50 | 0.584 |
| Male | 166(66.1) | 113(63.1) | 53(73.6) | 0.112 | 23(62.2) | 143(66.8) | 0.580 |
| GCS | 14(10,15) | 13(8,15) | 15(14,15) | <0.001 | 8(7,13) | 14(12,15) | <0.001 |
| Admission SBP (mmHg) | 166.69 ± 26.58 | 167.77 ± 26.72 | 164.03 ± 26.23 | 0.342 | 160.14 ± 25.42 | 167.83 ± 26.67 | 0.128 |
| Admission DBP (mmHg) | 97.59 ± 18.51 | 97.47 ± 18.31 | 97.86 ± 19.12 | 0.833 | 93.73 ± 18.31 | 98.25 ± 18.50 | 0.155 |
| Onset to CT (hours) | 6(4,12) | 6(4,12) | 6(4,17) | 0.375 | 6(3,17) | 6(4,12) | 0.854 |
| History of hypertension | 142(56.6) | 104(58.1) | 38(52.8) | 0.342 | 18(48.6) | 124(57.9) | 0.292 |
| History of diabetes mellitus | 16(6.4) | 14(7.8) | 2(2.8) | 0.233 | 0(0.0) | 16(7.5) | 0.176 |
| Smoking | 71(28.3) | 54(30.2) | 17(23.6) | 0.297 | 6(16.2) | 65(30.4) | 0.077 |
| Previous stroke | 13(5.2) | 10(5.6) | 3(4.2) | 0.885 | 0(0.0) | 13(6.1) | 0.255 |
| Antiplatelet or anticoagulation | 19(7.6) | 11(6.1) | 8(11.1) | 0.179 | 4(10.8) | 15(7.0) | 0.638 |
| Hematoma volume (mL) | 18.48(7.80,35.20) | 22.80(9.24,36.75) | 9.22(2.66,27.27) | <0.001 | 35.34(20.70,48.78) | 15.72(7.01,31.49) | <0.001 |
| Hematoma location | |||||||
| Supratentorial | 207(82.5) | 159(88.8) | 48(66.7) | <0.001 | 33(89.2) | 174(82.2) | 0.244 |
| Infratentorial | 44(17.5) | 20(11.2) | 24(33.3) | 4(10.8) | 40(17.8) | ||
| Presence of IVH | 91(36.3) | 80(44.7) | 11(15.3) | <0.001 | 24(64.9) | 67(31.3) | <0.001 |
| Presence of HE | 59(23.5) | 47(26.3) | 12(16.7) | 0.105 | 16(43.2) | 43(20.1) | 0.002 |
| Treatment | |||||||
| Surgical intervention | 49(19.5) | 45(25.1) | 4(5.6) | <0.001 | 11(29.7) | 38(17.8) | 0.090 |
| Conservative treatment | 202(80.5) | 134(74.9) | 68(94.4) | 26(70.3) | 176(82.2) | ||
| PLT (10ˆ9/L) | 152(115,204) | 152(114,203) | 153(116,210) | 0.634 | 127(105,195) | 157(120,209) | 0.036 |
| PT (s) | 11.5(10.9,12.4) | 11.4(10.9,12.2) | 11.5(10.9,12.5) | 0.659 | 12.4(11.1,13.2) | 11.4(10.9,12.1) | 0.006 |
| APTT (s) | 26.5(23.6,29.3) | 26.3(23.6,29.0) | 26.7(23.4,29.8) | 0.634 | 27.8(24.8,31.4) | 26.3(23.6,29.0) | 0.069 |
| INR | 0.99(0.93,1.06) | 0.98(0.93,1.06) | 1.00(0.94,1.08) | 0.254 | 1.05(0.94,1.13) | 0.98(0.93,1.05) | 0.018 |
| NLR | 8.18(4.88,12.72) | 8.94(5.38,13.88) | 6.45(4.48,9.73) | 0.001 | 16.73(9.05,21.89) | 7.27(4.48,10.79) | <0.001 |
| Fibrinogen (g/L) | 2.76(2.37,3.34) | 2.98(2.43,3.51) | 2.50(2.25,2.87) | <0.001 | 3.54(3.04,4.82) | 2.65(2.32,3.22) | <0.001 |
| F-NLR score | |||||||
| 0 | 111(44.2) | 64(35.8) | 47(65.3) | <0.001 | 1(2.7) | 110(51.4) | <0.001 |
| 1 | 87(34.7) | 62(34.6) | 25(34.7) | 15(40.5) | 72(33.6) | ||
| 2 | 53(21.1) | 53(29.6) | 0(0.0) | 21(56.8) | 32(15.0) | ||
Data are expressed as n (%), mean ± SD, or median (25th, 75th quartile). Abbreviation: ICH, intracerebral hemorrhage; SD, standard deviation; GCS, Glasgow Coma Scale; SBP, systolic blood pressure; DBP, diastolic blood pressure; IVH, intraventricular hemorrhage; HE, hematoma expansion; PLT, platelet; PT, prothrombin time; APTT, activated partial thromboplastin time; INR, international normalized ratio; F, fibrinogen; NLR, neutrophil to lymphocyte ratio.
3.2. Associations of F-NLR Score with Primary Outcomes
Multivariate logistic regression was conducted to further determine the independent risk factors for primary outcomes. In the original cohort (Table 3), F-NLR score (adjusted OR 2.013, 95% CI 1.316-3.078, p = 0.001; adjusted OR3.036, 95% CI1.965-4.693, p < 0.001, respectively) and its component fibrinogen (adjusted OR 1.852, 95% CI1.271-2.699, p = 0.001; adjusted OR1.946, 95% CI1.477-2.564, p < 0.001, respectively) could independently predict 3-month functional outcome and 1-month mortality. Whereas NLR could independently predicted 1-moth mortality (adjusted OR, 1.069, 95% CI 1.028-1.110, p = 0.001), but not 3-month functional outcome (adjusted OR, 1.034, 95% CI 0.981-1.089, p = 0.209). Similarly in validation cohort, NLR, fibrinogen, and F-NLR score were independent risk factors for primary outcomes. Other independent risk factors for ICH were listed in Supplementary Table 1 and Table 2.
Table 3.
Multivariate logistic regression of NLR, fibrinogen, and F-NLR score in the original and validation cohorts.
(a).
| Original cohort | Multivariate logistic regression | |
|---|---|---|
| 3-month functional outcome | Adjusted OR (95% CI) | p value |
| NLR (per 1 point increase) | 1.034(0.981-1.089) | 0.209 |
| Fibrinogen (per 1 g/L increase) | 1.852(1.271-2.699) | 0.001 |
| F-NLR score (per 1 point increase) | 2.013(1.316-3.078) | 0.001 |
| 1-month mortality | Adjusted OR (95% CI) | p value |
| NLR (per 1 point increase) | 1.069(1.028-1.110) | 0.001 |
| Fibrinogen (per 1 g/L increase) | 1.946(1.477-2.564) | <0.001 |
| F-NLR score (per 1 point increase) | 3.036(1.965-4.693) | <0.001 |
(b).
| Validation cohort | Multivariate logistic regression | |
|---|---|---|
| 3-month functional outcome | Adjusted OR (95% CI) | p value |
| NLR (per 1 point increase) | 1.086(1.015-1.163) | 0.018 |
| Fibrinogen (per 1 g/L increase) | 1.857(1.137-3.032) | 0.013 |
| F-NLR score (per 1 point increase) | 4.008(2.267-7.088) | <0.001 |
| 1-month mortality | Adjusted OR (95% CI) | p value |
| NLR (per 1 point increase) | 1.181(1.099-1.268) | <0.001 |
| Fibrinogen (per 1 g/L increase) | 2.400(1.444-3.987) | 0.001 |
| F-NLR score (per 1 point increase) | 7.629(3.524-16.516) | <0.001 |
Abbreviation: F, fibrinogen; NLR, neutrophil to lymphocyte ratio; OR, odds ratio; CI, confidence interval.
3.3. Predictive Ability of F-NLR Score, Fibrinogen, and NLR in Primary Outcomes
ROC curves were used to preliminarily assess the predictive ability of F-NLR score, fibrinogen, and NLR in primary outcomes of ICH patients. In original cohort, F-NLR score had stronger predictive ability in 3-month outcome (Figure 2(a), area under the curve (AUC) 0.663, 0.652, 0.605, respectively) and 1-month mortality (Figure 2(b), AUC 0.728, 0.716, 0.713, respectively) than fibrinogen and NLR. In validation cohort, the predictive ability in 3-month mortality (Figure 2(c), AUC 0.699, 0.660, 0.628, respectively) and 1-month mortality (Figure 2(d), AUC 0.809, 0.768, 0.788, respectively) of F-NLR score was still superior to fibrinogen and NLR. DeLong's test only indicated a significant difference between F-NLR score and NLR of AUC in 3-month functional outcome in original cohort (p = 0.022) and validation cohort (p = 0.027), whereas there was no significant difference between F-NLR score and NLR in predicting 1-month mortality. DeLong's test also indicated that no significant difference was found in AUC between fibrinogen and either of the other two markers.
Figure 2.
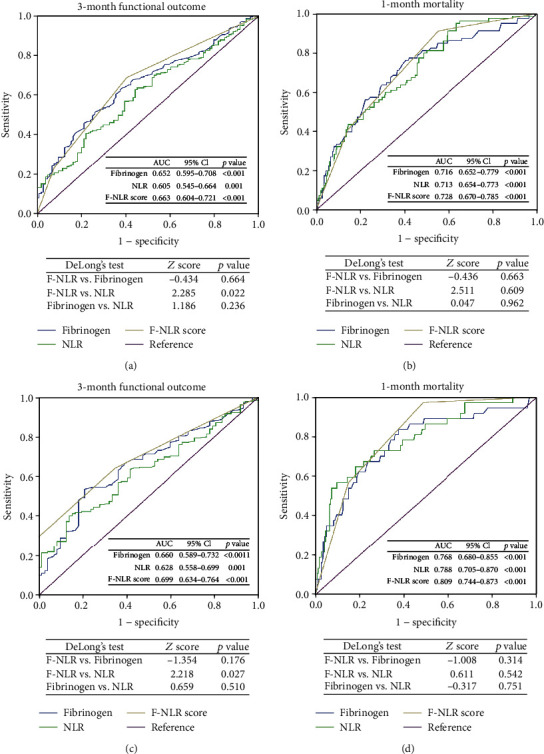
ROC curves of F-NLR score, fibrinogen, and NLR for predicting 3-month functional outcome and 1-month mortality in the original cohort (a, b) and the validation cohort (c, d). Abbreviation: ROC, receiver operating characteristic; F, fibrinogen; NLR, neutrophil to lymphocyte ratio; AUC, area under the curve; CI, confidence interval.
Predictive models were conducted to further assess the predive accuracy of inflammatory markers in outcomes. Independent predictive indicators in multivariate logistic regression constituted predictive models. Apart from fibrinogen, NLR, and F-NLR score, other independent variables constituted basic models. As shown in Table 4, basic models plus F-NLR score had largest C-index and lowest AIC in predicting outcomes in original and validation cohorts.
Table 4.
Predictive models for predicting primary outcomes of ICH patients.
(a).
| Original cohort | 3-month functional outcome | Original cohort | 1-month mortality | ||
|---|---|---|---|---|---|
| Predictive models | C-index | AIC | Predictive models | C-index | AIC |
| Basic model§ | 0.8616 | 339.4594 | Basic model† | 0.8203 | 330.1387 |
| Basic model+fibrinogen | 0.8729 | 331.9510 | Basic model+fibrinogen | 0.8518 | 306.0032 |
| Basic model+NLR | 0.8634 | 338.3470 | Basic model+NLR | 0.8460 | 318.2431 |
| Basic model+F-NLR score | 0.8731 | 329.4173 | Basic model+F-NLR score | 0.8589 | 306.0029 |
(b).
| Validation cohort | 3-month functional outcome | Validation cohort | 1-month mortality | ||
|---|---|---|---|---|---|
| Predictive models | C-index | AIC | Predictive models | C-index | AIC |
| Basic model‡ | 0.8108 | 240.9239 | Basic model∗ | 0.7834 | 179.8238 |
| Basic model+fibrinogen | 0.8319 | 232.0876 | Basic model+fibrinogen | 0.8362 | 162.7893 |
| Basic model+NLR | 0.8300 | 232.9518 | Basic model+NLR | 0.8591 | 149.2128 |
| Basic model+F-NLR score | 0.8694 | 209.8464 | Basic model+F-NLR score | 0.8876 | 147.3019 |
§Basic model: GCS, hematoma volume, hematoma location, treatment;†basic model: GCS, hematoma volume, presence of IVH, PT;‡Basic model: GCS, hematoma location, treatment;∗basic model: GCS, hematoma volume, presence of HE, PLT, PT. Abbreviation: GCS, Glasgow Coma Scale; IVH, intraventricular hemorrhage; HE, hematoma expansion; PLT, platelet; PT, prothrombin time; C-index, Harrell's concordance index; AIC, Akaike information criterion; F, fibrinogen; NLR, neutrophil to lymphocyte ratio; OR, odds ratio; CI, confidence interval.
4. Discussion
This study was conducted to explore the clinical significance of F-NLR score in ICH patients. We found that F-NLR score was an independent indicator for both the 3-month functional outcome and the 1-month mortality in original cohort, and its prognostic predictive ability was superior to fibrinogen and NLR. These results were verified in independent validation cohort.
NLR was a common peripheral marker used in fields of various disease like tumors, rheumatic diseases, cardiovascular diseases, and other chronic diseases, including corona virus disease-19 (COVID-19). [21–26] Because inflammation was characterized by higher neutrophil count and lower lymphocyte count, NLR could predict disease progression by reflecting the inflammatory burden. Based on these facts, NLR was reported to be a prognostic indicator for patients with ischemic stroke, ICH, and subarachnoid hemorrhage and also predicted the presence of stroke-associated complications, suggesting that both ischemic and hemorrhagic stroke may share common pathways. [27–33] However, controversial results showed that although inflammatory biomarkers in the serum were widely studied to predict the outcome of ICH, NLR seems to be not well enough in the prediction [34].
Fibrinogen, synthesized by hepatocytes in the liver and circulating in the bloodstream, plays a complex role in ICH. It participates in the process of blood coagulation and induces neuroinflammation by activating microglia and promoting the recruitment and activation of peripheral inflammatory macrophages into the central nervous system by converting into fibrin. [35] Inhibition of fibrin formation could reduce neuroinflammation and improve long-term outcome in mice with ICH models. [36] Studies showed that low fibrinogen concentration was an independent predictors of good outcome in medium to large spontaneous ICH. [8] Moreover, D-dimer, a soluble fibrin degradation product that results from ordered breakdown of thrombi by the fibrinolytic system, was also reported to be associated with poor outcome in ICH. [37–39]
In this study, we demonstrate that NLR combined with fibrinogen was reliable to predict the outcome of intracerebral hemorrhage than NLR or fibrinogen alone. To combine fibrinogen and NLR together, Arigami et al. firstly introduced F-NLR score in the research of esophageal squamous cell carcinoma and demonstrated that F-NLR was an independent prognostic indicator. [40] Although several oncology studies tested the prognostic significance of F-NLR score, few of them compared the predictive ability between F-NLR score with its components. Therefore, whether F-NLR score has superiority in prognostic predictive capacity is yet to be determined. It's noted that Chen et al. found F-NLR score had stronger predictive ability in 3-year progression-free survival both in training set and validation set. [13] Here, we demonstrated that F-NLR score had better predictive accuracy in primary outcomes than fibrinogen or NLR alone through ROC analysis and conducting predictive models. This easily-acquired and almost undamaged peripheral blood marker not only is economical, but also helps clinical workers distinguish the severity of ICH through combining with crucial prognostic indicators like ICH volume, presence of HE or IVH, thus undertaking inchoate interventions and making the optimal treatment plans. Combined with imaging characteristic like spot sign, island sign and satellite sign, the prognostic models will be enriched to further improve the predictive accuracy in disease-progression and prognosis of ICH. [41] In addition, a variety of factors related to metabolic homeostasis, blood perfusion, drug reaction, and condition of nutrition are strongly affecting the prognosis in short and long-term outcomes, multidimensional and comprehensive evaluations of ICH patients are needed. [42–46] There were still some limitations that merit consideration. First, current results were concluded from a single center, and multicenter collaboration will be needed for further verification. Second, not all patients were admitted to hospital within similar intervals after onset, this might induce unknown bias in laboratory results. Third, severe cases with early mortality after admission might cause selection bias. Finally, long-term outcomes should be introduced to comprehensively evaluate the prognostic significance of candidate markers in the future.
5. Conclusion
In summary, we demonstrate that F-NLR score was an independent indicator for both 3-month functional outcome and 1-month mortality, and its prognostic predictive ability was superior to fibrinogen and NLR in both the original and validation cohorts. Our findings provide a novel prognostic predictor for the outcome of ICH and deserve potential clinical application.
Acknowledgments
This work was supported by Postdoctoral Research and Development Programs of Sichuan University (Grant number 2021SCU12025), Science and Technology Department of Sichuan Province (Grant Number 2020YFQ0009), and Outstanding Subject Development 135 Project of West China Hospital, Sichuan University (Grant Number ZY2016102). The authors would like to thank Master Zheng for his valuable advice to this work. Thanks for the great support of our team of ICH and to all the medical staff working in the front line.
Data Availability
The datasets for this study are available from the corresponding author on reasonable request.
Conflicts of Interest
The authors declare no conflict of interest.
Authors' Contributions
Jun Zheng, Junhong Li, and Wanchun Yang contributed to the study design. Junhong Li, Hao Li, Zhiyuan Yu, and Yuli Shuai were responsible for the retrieval of data. Junhong Li, Xiang Liao, and Jun Zheng performed the statistical analyses. Junhong Li and Wanchun Yang were responsible for the result interpretation. Junhong Li and Wanchun Yang wrote the original draft. Jun Zheng, Hao Li, and Zhiyuan Yu contributed to the writing-review and editing. Jun Zheng and Zhiyuan Yu were responsible for the acquisition of funding.
Supplementary Materials
Supplementary Table 1. Multivariate logistic regression of included clinical variables for primary outcomes in original cohort. Supplementary Table 2 Multivariate logistic regression of included clinical variables for primary outcomes in validation cohort.
References
- 1.Cordonnier C., Demchuk A., Ziai W., Anderson C. S. Intracerebral haemorrhage: current approaches to acute management. Lancet . 2018;392(10154):1257–1268. doi: 10.1016/S0140-6736(18)31878-6. [DOI] [PubMed] [Google Scholar]
- 2.Hostettler I. C., Seiffge D. J., Werring D. J. Intracerebral hemorrhage: an update on diagnosis and treatment. Expert Review of Neurotherapeutics . 2019;19(7):679–694. doi: 10.1080/14737175.2019.1623671. [DOI] [PubMed] [Google Scholar]
- 3.Chen S., Yang Q., Chen G., Zhang J. H. An update on inflammation in the acute phase of intracerebral hemorrhage. Translational Stroke Research . 2015;6(1):4–8. doi: 10.1007/s12975-014-0384-4. [DOI] [PubMed] [Google Scholar]
- 4.Zhou Y., Wang Y., Wang J., Anne Stetler R., Yang Q. W. Inflammation in intracerebral hemorrhage: from mechanisms to clinical translation. Progress in Neurobiology . 2014;115:25–44. doi: 10.1016/j.pneurobio.2013.11.003. [DOI] [PubMed] [Google Scholar]
- 5.Emsley H. C., Tyrrell P. J. Inflammation and infection in clinical stroke. Journal of Cerebral Blood Flow and Metabolism . 2002;22(12):1399–1419. doi: 10.1097/01.WCB.0000037880.62590.28. [DOI] [PubMed] [Google Scholar]
- 6.Lattanzi S., Brigo F., Trinka E., Cagnetti C., Di Napoli M., Silvestrini M. Neutrophil-to-lymphocyte ratio in acute cerebral hemorrhage: a system review. Translational Stroke Research . 2019;10(2):137–145. doi: 10.1007/s12975-018-0649-4. [DOI] [PubMed] [Google Scholar]
- 7.Walsh K. B., Sekar P., Langefeld C. D., et al. Monocyte count and 30-day case fatality in intracerebral hemorrhage. Stroke . 2015;46(8):2302–2304. doi: 10.1161/STROKEAHA.115.009880. [DOI] [PMC free article] [PubMed] [Google Scholar]
- 8.Castellanos M., Leira R., Tejada J., et al. Predictors of good outcome in medium to large spontaneous supratentorial intracerebral haemorrhages. Journal of Neurology, Neurosurgery, and Psychiatry . 2005;76(5):691–695. doi: 10.1136/jnnp.2004.044347. [DOI] [PMC free article] [PubMed] [Google Scholar]
- 9.Limaye K., Yang J. D., Hinduja A. Role of admission serum albumin levels in patients with intracerebral hemorrhage. Acta Neurologica Belgica . 2016;116(1):27–30. doi: 10.1007/s13760-015-0504-2. [DOI] [PubMed] [Google Scholar]
- 10.Tao C., Wang J., Hu X., Ma J., Li H., You C. Clinical value of neutrophil to lymphocyte and platelet to lymphocyte ratio after aneurysmal subarachnoid hemorrhage. Neurocritical Care . 2017;26(3):393–401. doi: 10.1007/s12028-016-0332-0. [DOI] [PubMed] [Google Scholar]
- 11.Di Napoli M., Slevin M., Popa-Wagner A., Singh P., Lattanzi S., Divani A. A. Monomeric C-reactive protein and cerebral hemorrhage: from bench to bedside. Frontiers in Immunology . 2018;9:p. 1921. doi: 10.3389/fimmu.2018.01921. [DOI] [PMC free article] [PubMed] [Google Scholar]
- 12.Wang H., Zhao J., Zhang M., Han L., Wang M., Xingde L. The combination of plasma fibrinogen and neutrophil lymphocyte ratio (F-NLR) is a predictive factor in patients with resectable non small cell lung cancer. Journal of Cellular Physiology . 2018;233(5):4216–4224. doi: 10.1002/jcp.26239. [DOI] [PubMed] [Google Scholar]
- 13.Chen X., Wang G., Zhang J., et al. A novel scoring system based on preoperative routine blood test in predicting prognosis of atypical meningioma. Frontiers in Oncology . 2020;10:p. 1705. doi: 10.3389/fonc.2020.01705. [DOI] [PMC free article] [PubMed] [Google Scholar]
- 14.Kijima T., Arigami T., Uchikado Y., et al. Combined fibrinogen and neutrophil-lymphocyte ratio as a prognostic marker of advanced esophageal squamous cell carcinoma. Cancer Science . 2017;108(2):193–199. doi: 10.1111/cas.13127. [DOI] [PMC free article] [PubMed] [Google Scholar]
- 15.Hemphill J. C., 3rd, Greenberg S. M., Anderson C. S., et al. Guidelines for the Management of Spontaneous Intracerebral Hemorrhage. Stroke . 2015;46(7):2032–2060. doi: 10.1161/STR.0000000000000069. [DOI] [PubMed] [Google Scholar]
- 16.Steiner T., al-Shahi Salman R., Beer R., et al. European stroke organisation (ESO) guidelines for the management of spontaneous intracerebral hemorrhage. International Journal of Stroke . 2014;9(7):840–855. doi: 10.1111/ijs.12309. [DOI] [PubMed] [Google Scholar]
- 17.Li J., Liao X., Yu Z., Li H., Zheng J. Predictive ability of Ultraearly hematoma growth and spot sign for redefined hematoma expansion in patients with spontaneous intracerebral hemorrhage. Journal of Stroke and Cerebrovascular Diseases . 2021;30(9, article 105950) doi: 10.1016/j.jstrokecerebrovasdis.2021.105950. [DOI] [PubMed] [Google Scholar]
- 18.Demchuk A. M., Dowlatshahi D., Rodriguez-Luna D., et al. Prediction of haematoma growth and outcome in patients with intracerebral haemorrhage using the CT-angiography spot sign (PREDICT): a prospective observational study. The Lancet Neurology . 2012;11(4):307–314. doi: 10.1016/S1474-4422(12)70038-8. [DOI] [PubMed] [Google Scholar]
- 19.Vrieze S. I. Model selection and psychological theory: a discussion of the differences between the Akaike information criterion (AIC) and the Bayesian information criterion (BIC) Psychological Methods . 2012;17(2):228–243. doi: 10.1037/a0027127. [DOI] [PMC free article] [PubMed] [Google Scholar]
- 20.Harrell F. E., Lee K. L., Mark D. B. Multivariable prognostic models: issues in developing models, evaluating assumptions and adequacy, and measuring and reducing errors. Statistics in Medicine . 1996;15(4):361–387. doi: 10.1002/(SICI)1097-0258(19960229)15:4<361::AID-SIM168>3.0.CO;2-4. [DOI] [PubMed] [Google Scholar]
- 21.Templeton A. J., McNamara M. G., Šeruga B., et al. Prognostic role of neutrophil-to-lymphocyte ratio in solid tumors: a systematic review and meta-analysis. Journal of the National Cancer Institute . 2014;106(6, article dju124) doi: 10.1093/jnci/dju124. [DOI] [PubMed] [Google Scholar]
- 22.Erre G. L., Paliogiannis P., Castagna F., et al. Meta-analysis of neutrophil-to-lymphocyte and platelet-to-lymphocyte ratio in rheumatoid arthritis. Archiv für Klinische Medizin . 2019;49(1, article e13037) doi: 10.1111/eci.13037. [DOI] [PubMed] [Google Scholar]
- 23.Angkananard T., Anothaisintawee T., McEvoy M., Attia J., Thakkinstian A. Neutrophil Lymphocyte Ratio and Cardiovascular Disease Risk: A Systematic Review and Meta-Analysis. BioMed Research International . 2018;2018:11. doi: 10.1155/2018/2703518.2703518 [DOI] [PMC free article] [PubMed] [Google Scholar]
- 24.Fu J., Kong J., Wang W., et al. The clinical implication of dynamic neutrophil to lymphocyte ratio and D-dimer in COVID-19: a retrospective study in Suzhou China. Thrombosis Research . 2020;192:3–8. doi: 10.1016/j.thromres.2020.05.006. [DOI] [PMC free article] [PubMed] [Google Scholar]
- 25.Liang W., Liang H., Ou L., et al. Development and validation of a clinical risk score to predict the occurrence of critical illness in hospitalized patients with COVID-19. JAMA Internal Medicine . 2020;180(8):1081–1089. doi: 10.1001/jamainternmed.2020.2033. [DOI] [PMC free article] [PubMed] [Google Scholar]
- 26.Tatum D., Taghavi S., Houghton A., Stover J., Toraih E., Duchesne J. Neutrophil-to-lymphocyte ratio and outcomes in Louisiana COVID-19 patients. Shock (Augusta, Ga) . 2020;54(5):652–658. doi: 10.1097/SHK.0000000000001585. [DOI] [PMC free article] [PubMed] [Google Scholar]
- 27.Yu S., Arima H., Bertmar C., Clarke S., Herkes G., Krause M. Neutrophil to lymphocyte ratio and early clinical outcomes in patients with acute ischemic stroke. Journal of the Neurological Sciences . 2018;387:115–118. doi: 10.1016/j.jns.2018.02.002. [DOI] [PubMed] [Google Scholar]
- 28.Wang L., Song Q., Wang C., et al. Neutrophil to lymphocyte ratio predicts poor outcomes after acute ischemic stroke: a cohort study and systematic review. Journal of the Neurological Sciences . 2019;406, article 116445 doi: 10.1016/j.jns.2019.116445. [DOI] [PubMed] [Google Scholar]
- 29.Lattanzi S., Cagnetti C., Rinaldi C., Angelocola S., Provinciali L., Silvestrini M. Neutrophil-to-lymphocyte ratio improves outcome prediction of acute intracerebral hemorrhage. Journal of the Neurological Sciences . 2018;387:98–102. doi: 10.1016/j.jns.2018.01.038. [DOI] [PubMed] [Google Scholar]
- 30.Nam K. W., Kim T. J., Lee J. S., et al. High neutrophil-to-lymphocyte ratio predicts stroke-associated pneumonia. Stroke . 2018;49(8):1886–1892. doi: 10.1161/STROKEAHA.118.021228. [DOI] [PubMed] [Google Scholar]
- 31.Giede-Jeppe A., Reichl J., Sprügel M. I., et al. Neutrophil-to-lymphocyte ratio as an independent predictor for unfavorable functional outcome in aneurysmal subarachnoid hemorrhage. Journal of Neurosurgery . 2019;132(2):400–407. doi: 10.3171/2018.9.JNS181975. [DOI] [PubMed] [Google Scholar]
- 32.Lattanzi S., Norata D., Divani A. A., et al. Systemic inflammatory response index and futile recanalization in patients with ischemic stroke undergoing endovascular treatment. Brain Sciences . 2021;11(9):p. 1164. doi: 10.3390/brainsci11091164. [DOI] [PMC free article] [PubMed] [Google Scholar]
- 33.Świtońska M., Piekuś-Słomka N., Słomka A., Sokal P., Żekanowska E., Lattanzi S. Neutrophil-to-lymphocyte ratio and symptomatic hemorrhagic transformation in ischemic stroke patients undergoing revascularization. Brain Sciences . 2020;10(11):p. 771. doi: 10.3390/brainsci10110771. [DOI] [PMC free article] [PubMed] [Google Scholar]
- 34.Troiani Z., Ascanio L., Rossitto C. P., et al. Prognostic utility of serum biomarkers in intracerebral hemorrhage: a systematic review. Neurorehabilitation and Neural Repair . 2021;35(11):946–959. doi: 10.1177/15459683211041314. [DOI] [PubMed] [Google Scholar]
- 35.Petersen M. A., Ryu J. K., Akassoglou K. Fibrinogen in neurological diseases: mechanisms, imaging and therapeutics. Nature Reviews Neuroscience . 2018;19(5):283–301. doi: 10.1038/nrn.2018.13. [DOI] [PMC free article] [PubMed] [Google Scholar]
- 36.Li X., Zhu Z., Gao S., et al. Inhibition of fibrin formation reduces neuroinflammation and improves long- term outcome after intracerebral hemorrhage. International Immunopharmacology . 2019;72:473–478. doi: 10.1016/j.intimp.2019.04.029. [DOI] [PubMed] [Google Scholar]
- 37.Weitz J. I., Fredenburgh J. C., Eikelboom J. W. A test in context: D-dimer. Journal of the American College of Cardiology . 2017;70(19):2411–2420. doi: 10.1016/j.jacc.2017.09.024. [DOI] [PubMed] [Google Scholar]
- 38.Zhou Q., Zhang D., Chen X., et al. Plasma D‐dimer predicts poor outcome and mortality after spontaneous intracerebral hemorrhage. Brain and Behavior . 2021;11(1):462–468. doi: 10.1002/brb3.1946. [DOI] [PMC free article] [PubMed] [Google Scholar]
- 39.Wei F., Cui Y., Guo X., Dong G., Li X. Correlations of inflammatory factors, CCCK-18, MMP-9 and D-dimer with APACHE II score and prognosis of patients with acute cerebral hemorrhage. Minerva Medica . 2020 doi: 10.23736/S0026-4806.20.06685-9. [DOI] [PubMed] [Google Scholar]
- 40.Arigami T., Okumura H., Matsumoto M., et al. Analysis of the fibrinogen and neutrophil-lymphocyte ratio in esophageal squamous cell carcinoma: a promising blood marker of tumor progression and prognosis. Medicine . 2015;94(42, article e1702) doi: 10.1097/MD.0000000000001702. [DOI] [PMC free article] [PubMed] [Google Scholar]
- 41.Sporns P. B., Schwake M., Schmidt R., et al. Computed tomographic blend sign is associated with computed tomographic angiography spot sign and predicts secondary neurological deterioration after intracerebral hemorrhage. Stroke . 2017;48(1):131–135. doi: 10.1161/STROKEAHA.116.014068. [DOI] [PubMed] [Google Scholar]
- 42.Morotti A., Busto G., Bernardoni A., Marini S., Casetta I., Fainardi E. Association between Perihematomal perfusion and intracerebral hemorrhage outcome. Neurocritical Care . 2020;33(2):525–532. doi: 10.1007/s12028-020-00929-z. [DOI] [PubMed] [Google Scholar]
- 43.Mayer S. A., Rincon F. Treatment of intracerebral haemorrhage. The Lancet Neurology . 2005;4(10):662–672. doi: 10.1016/S1474-4422(05)70195-2. [DOI] [PubMed] [Google Scholar]
- 44.Divani A. A., Liu X., di Napoli M., et al. Blood pressure variability predicts poor in-hospital outcome in spontaneous intracerebral hemorrhage. Stroke . 2019;50(8):2023–2029. doi: 10.1161/STROKEAHA.119.025514. [DOI] [PubMed] [Google Scholar]
- 45.Jafari M., di Napoli M., Lattanzi S., et al. Serum magnesium level and hematoma expansion in patients with intracerebral hemorrhage. Journal of the Neurological Sciences . 2019;398:39–44. doi: 10.1016/j.jns.2019.01.027. [DOI] [PubMed] [Google Scholar]
- 46.Zarean E., Lattanzi S., Looha M. A., et al. Glycemic gap predicts in-hospital mortality in diabetic patients with intracerebral hemorrhage. Journal of Stroke and Cerebrovascular Diseases: The Official Journal of National Stroke Association . 2021;30(5, article 105669) doi: 10.1016/j.jstrokecerebrovasdis.2021.105669. [DOI] [PubMed] [Google Scholar]
Associated Data
This section collects any data citations, data availability statements, or supplementary materials included in this article.
Supplementary Materials
Supplementary Table 1. Multivariate logistic regression of included clinical variables for primary outcomes in original cohort. Supplementary Table 2 Multivariate logistic regression of included clinical variables for primary outcomes in validation cohort.
Data Availability Statement
The datasets for this study are available from the corresponding author on reasonable request.