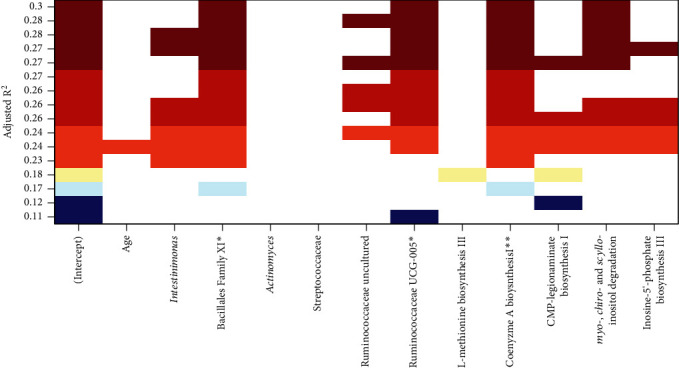
Figure 1.

All subset regression results showing, for each subset size, the two subsets of predictor variables yielding the highest adjusted R2 for predicting depressive symptom scores. ∗ indicates predictors (coefficients) significantly correlated with depression scores, based on permutation test p values in the final multiple regression model.
