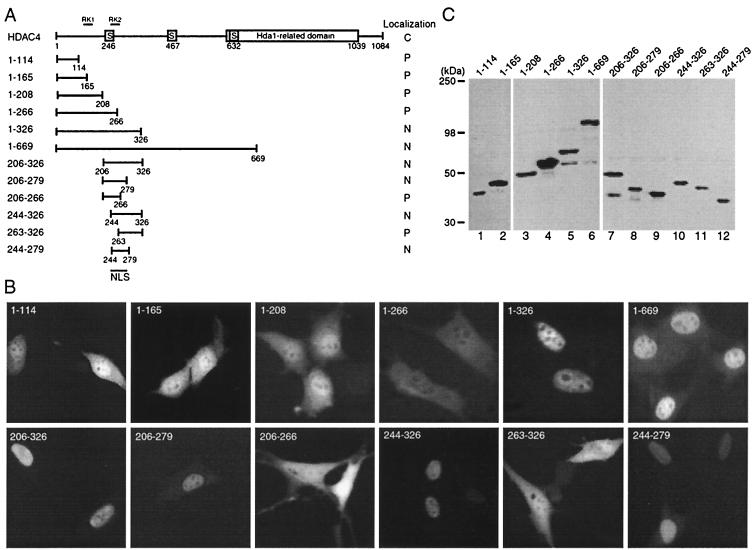
FIG. 3.
Mapping the NLS of HDAC4. (A) Schematic representation of HDAC4 and deletion mutants. Motifs or domains are depicted by boxes as in Fig. 1A. Also indicated are two arginine-lysine-rich regions: RK1 (residues 132 to 184) and RK2 (residues 242 to 283). (B) Representative green fluorescence images of living cells expressing HDAC4 mutants fused to GFP. NIH 3T3 cells were transfected with expression plasmids for indicated GFP fusion proteins and analyzed by live green fluorescence microscopy. (C) Expression of GFP fusion proteins. 293 cells were transfected with expression plasmids for indicated GFP fusion proteins, and total cell extracts were analyzed by immunoblotting with anti-GFP antibody.

