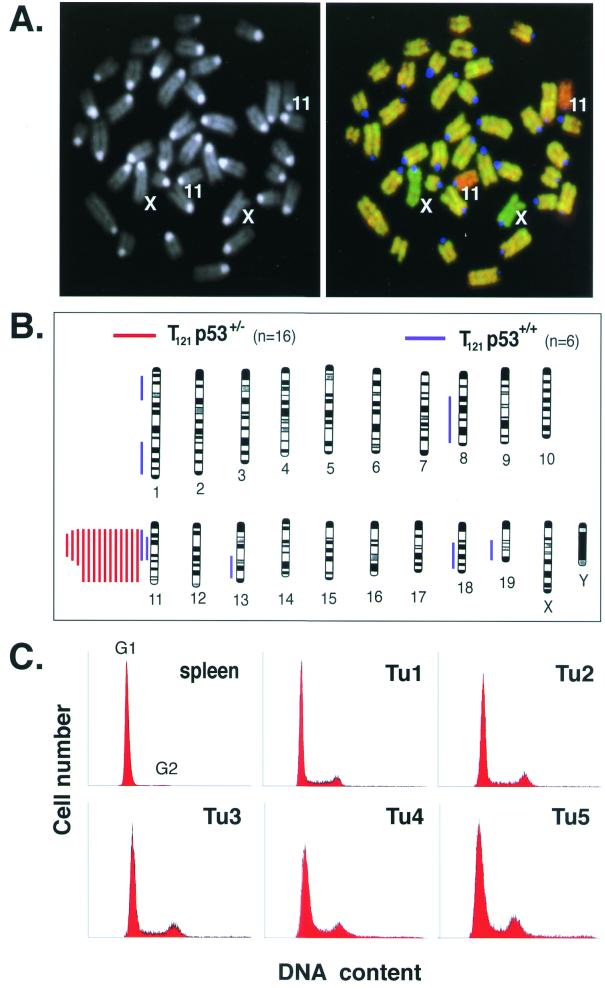
FIG. 6.
Chromosomal stability in p53-deficient tumors. (A) DAPI-stained metaphase chromosomes from normal mouse embryonic fibroblasts are shown, with chromosomes 11 and X indicated (left). A composite digital image from CGH analysis of a representative TgT121p53+/− terminal tumor is shown on the right. Tumor DNA (fluorescein isothiocyanate, green) and normal tail DNA (Alex-568, red) were hybridized to the metaphase spread shown in the left panel. Relative green regions indicate increased copy numbers in the tumor, while red regions indicate decreased copy numbers. The centromeres appear blue because repeated satellite sequences were blocked with unlabeled mouse Cot-1 DNA. This tumor sample shows loss of chromosome 11. Apparent gain of the X chromosome serves as an internal control; tumor DNA was derived from a female mouse, and normal DNA was from a male mouse. (B) Summary of CGH analysis of 14 TgT121p53+/− and 6 TgT121p53+/+ tumors. Each bar to the left of a depicted chromosome represents DNA copy number losses at the corresponding regions in a single tumor; no gains were detected. Signal intensities were consistent with loss of a single copy. Red bars represent TgT121p53+/− tumors, and blue bars represent TgT121p53+/+ tumors. Chromosomes were identified by DAPI banding. Black bands in the chromosome diagrams represent the observed DAPI staining pattern. (C) CP tumor cells from five TgT121 p53+/− mice were analyzed by propidium iodide staining and fluorescence-activated cell sorting analysis for DNA content. More than 90% of cells in all five tumors are diploid.

