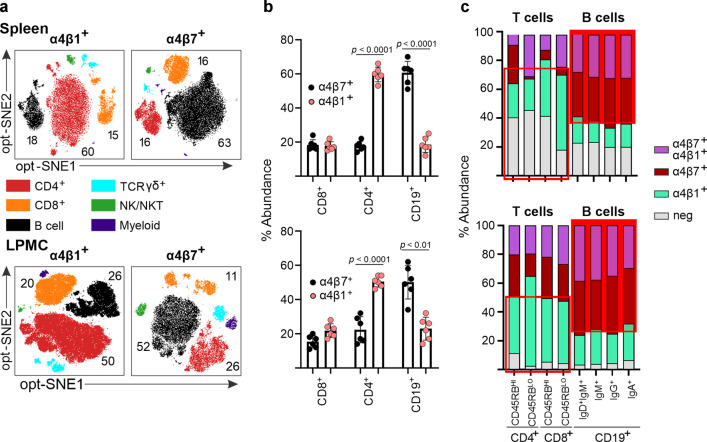
Fig. 1. B cells predominantly express α4β7 integrin.
a Cellular distribution of integrins α4β1 and α4β7 among the major leukocyte lineages within the peripheral (spleen) and mucosal (colonic LP) compartments. Cells were pregated on live, CD45+ cells, followed by opt-SNE analysis. Cell populations including CD4+ (CD4+ T cells), CD8+ (CD8+ T cells), CD19+/IgA+/IgG+ (B cells), TCRγδ+ (γδ T cells), CD56+ (NK/NKT), or MHCII+/CD11c+/CD11b+ (myeloid) cells are highlighted. b Percentages of α4β1- and α4β7-expressing cells within the indicated cell lineages from colonic LPMC and splenocytes. Each data point represents a single mouse. All data are presented as mean ± S.D, from n > 6 mice in each dataset. Statistical significance determined using ANOVA, followed by Tukey’s multiple comparison test. c Distribution of integrin expressing subpopulations within the CD4+, CD8+, and B-cell lineages. T- and B-cell populations were divided into the indicated memory subpopulations and the expression of α4β7 and α4β1 integrins determined.

