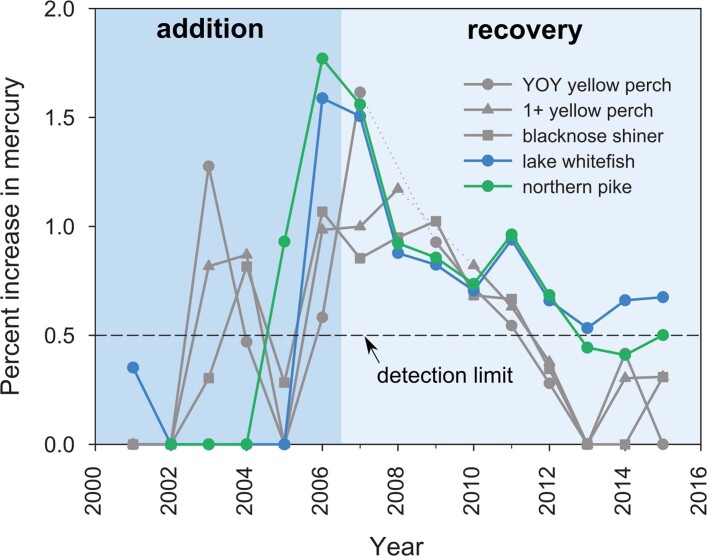
Extended Data Fig. 1. Temporal dynamics of upland mercury in fish.
Isotopic 198Hg added to the upland area of Lake 658 was above the detection limit (0.5% of ambient MeHg; dashed line) in all fish species, but contributed little (<2%) to overall MeHg concentrations (percent increase = [upland spike MeHg]/[ambient MeHg] × 100). Mean annual MeHg concentration data for each species or age-class is presented and based on fish collected during fall population sampling (n = 1,052; sample size details in Extended Data Tables 2 and 3); dotted lines indicate missing data
.

