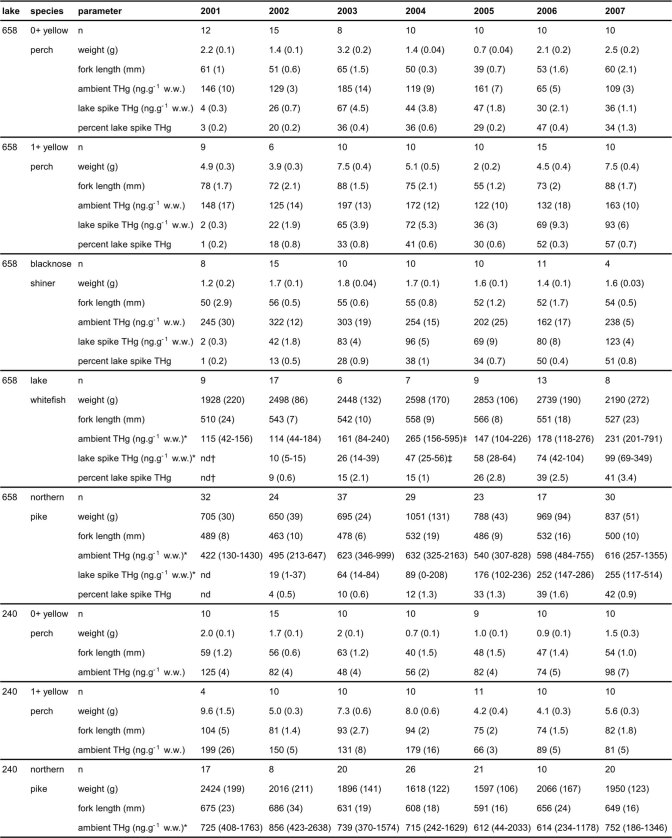
Extended Data Table 2.
Annual fish metrics and mercury concentrations during the addition phase
Footnote: Data presented are mean (± s.e.m.) of n fish measured and their muscle tissue analysed for ambient and lake spike MeHg concentrations (ng g−1 w.w., measured as THg), except for northern pike and lake whitefish where concentration data were standardized by fish length (range in parentheses). Percent lake spike THg = [lake spike THg]i/[ambient THg]i × 100. Isotopic Hg additions were made to Lake 658 from 2001–2007; Lake 240 is a reference lake. Fish collections occurred each autumn.
nd = not detected (detection limit for lake spike is 0.5% of ambient THg).
*Standardized by fish length (pike: 475 mm; whitefish: 535 mm).
†Two fish above detection limit.
‡Standardized with linear regression instead of polynomial.

