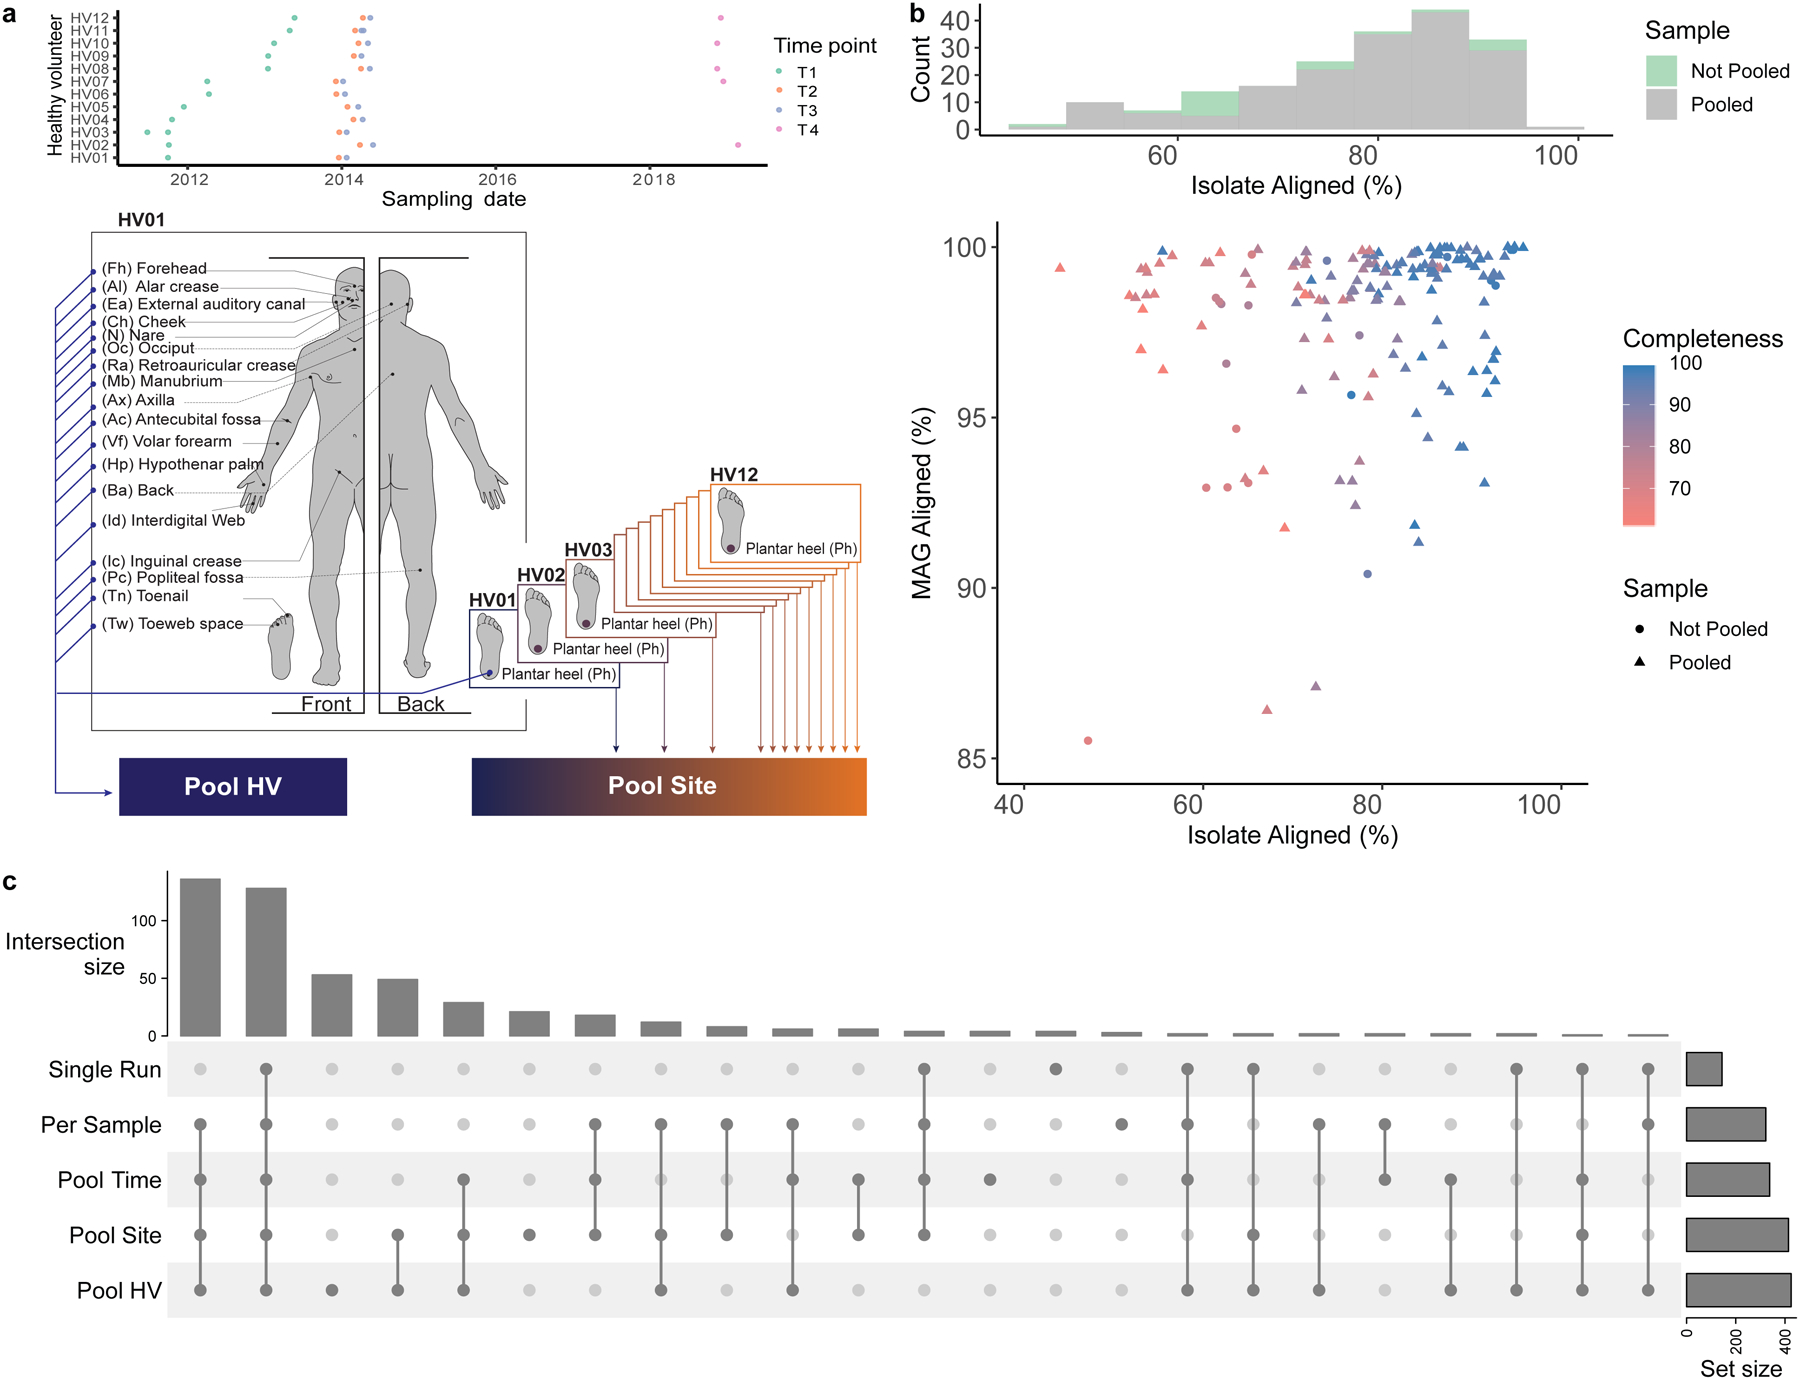
Fig. 1. Metagenome assembly strategies for the recovery of skin microbial genomes.

a, Samples obtained from 19 body sites of 12 healthy volunteers over 4 time points were collected and sequenced. Metagenomic datasets were concatenated per healthy volunteer (Pool HV), and per body site (Pool Site). For a description of all pooling strategies, including Pool Time, see Methods. b, Assessment of the quality of the MAG aligning best to each SBCC isolate. Histogram shows the number of MAGs from Single Run and Per Sample or Pooled (Pool Time, Pool HV, Pool Site) strategies that best align to an SBCC isolate. Graph depicts the percent aligned for each SBCC isolate and its corresponding MAG. c, UpSet plot showing the number of species recovered using the different assembly approaches.
