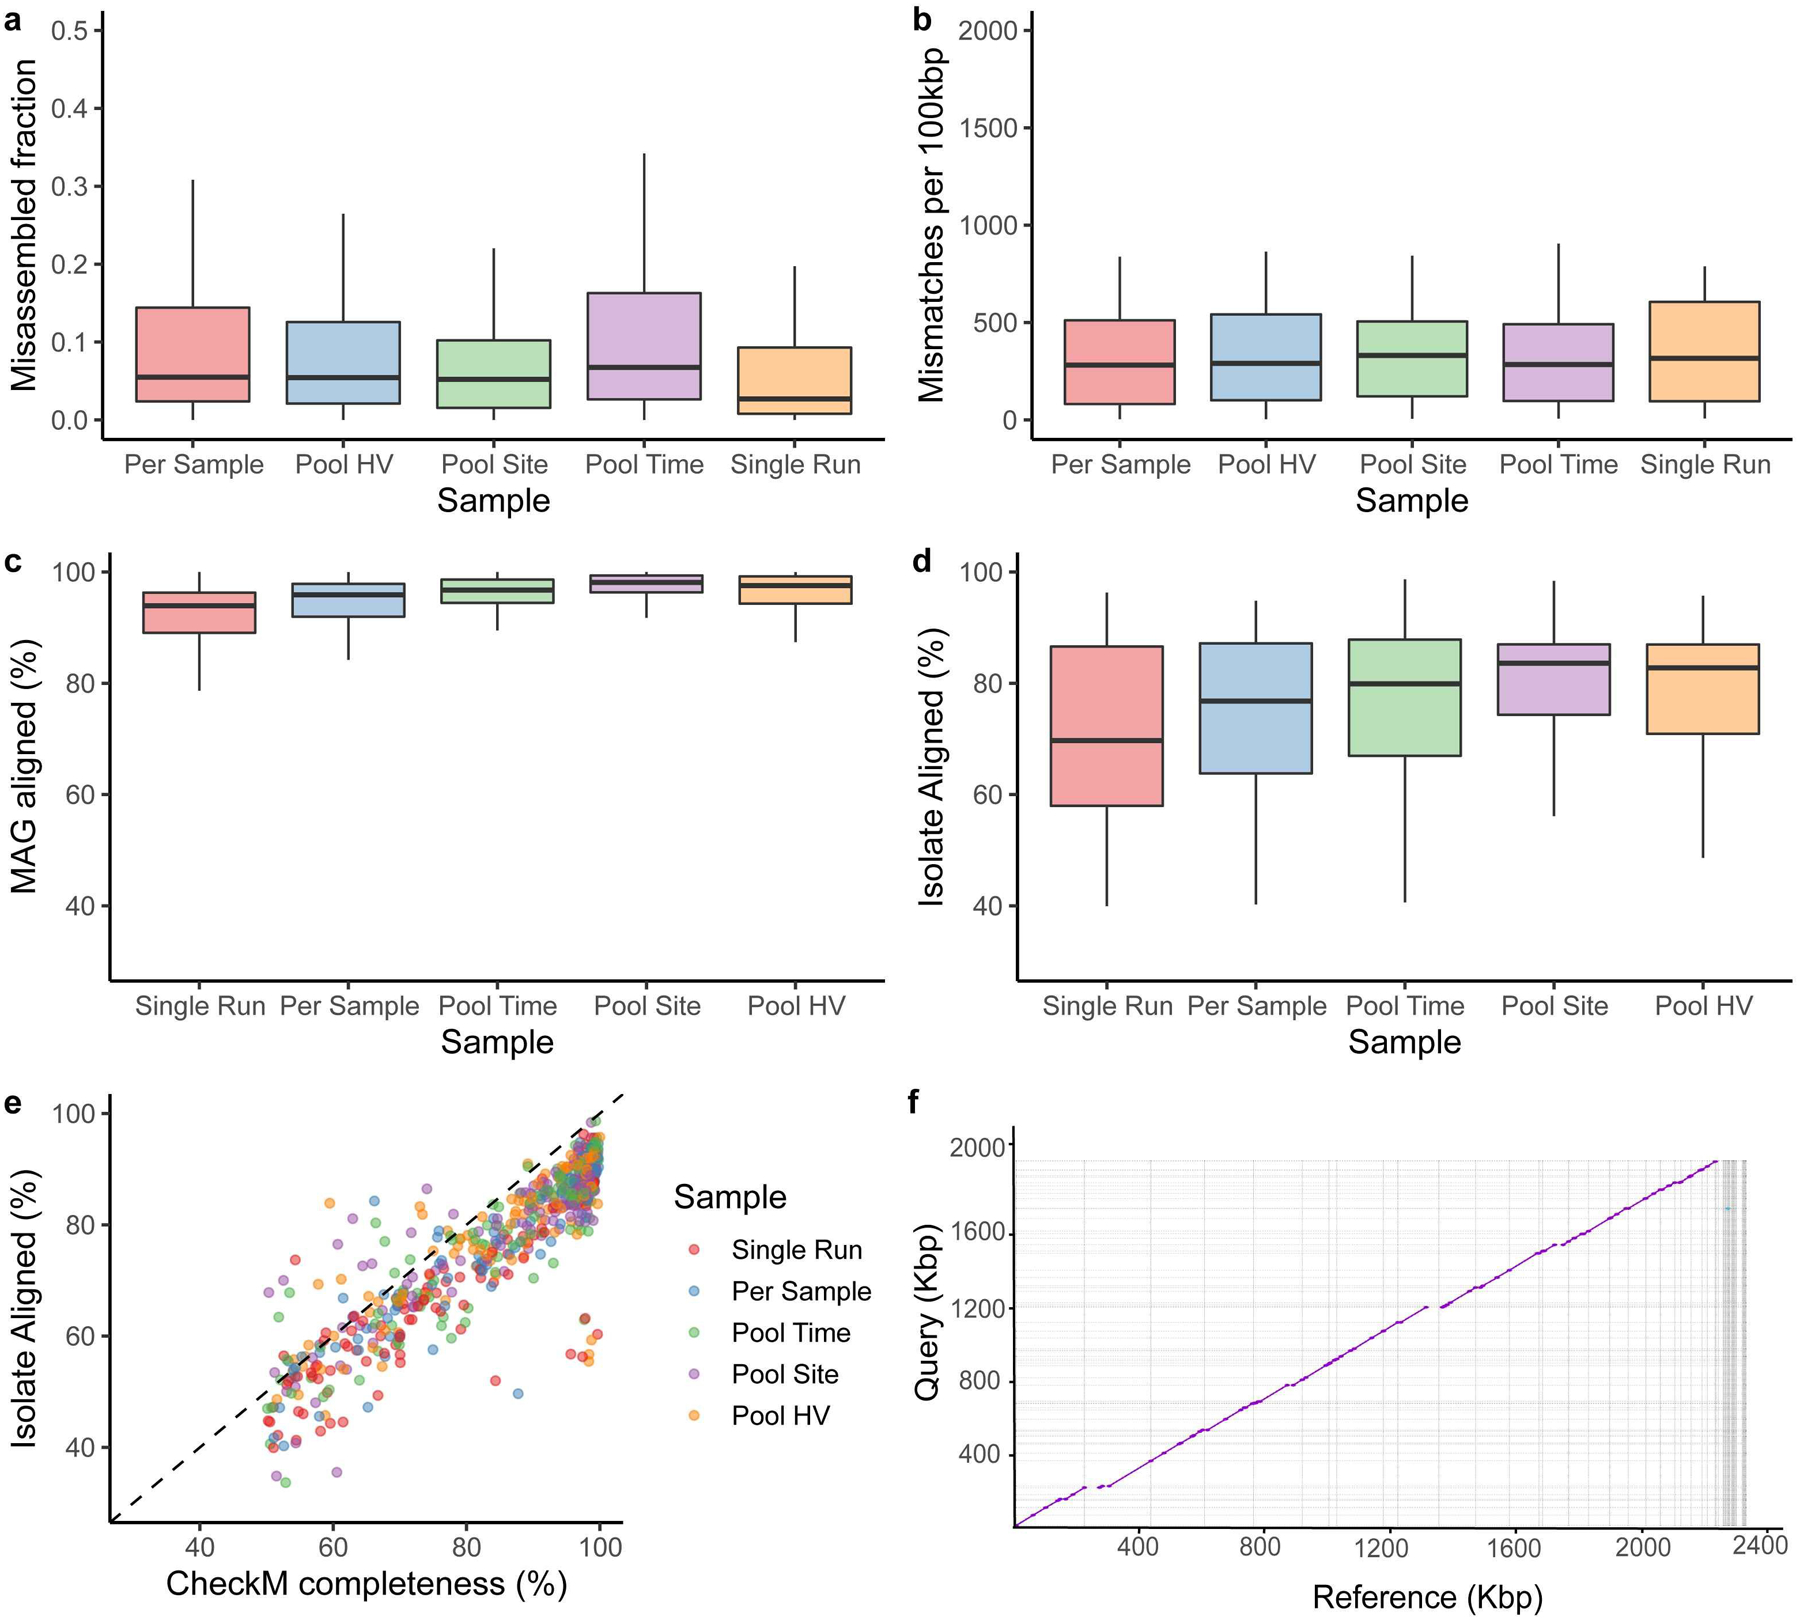
Extended Data Fig. 2. Comparison of MAG and SBCC isolate genomes.

a, Misassembled fraction as a proportion of the total genome length, estimated by QUAST. b, Single-nucleotide mismatches between MAGs and isolates per 100 kbp. c, percent MAG aligned, and d, percent isolate aligned for all pairwise MAG-isolate matches sharing >=99% average nucleotide identity across different pooling strategies (Single Run, n=124; Per Sample, n=91; Pool Time, n=116; Pool Site, n=134; Pool HV, n=115). e, CheckM completeness relative to percent isolate aligned for these MAGs, colored by pooling strategies. The majority of the points fall below the dashed identity line, indicating that CheckM frequently overestimates genome completeness f, Dot plot of a novel Corynebacterium MAG obtained through Pool HV and the matching isolate, cultured from the same healthy volunteer. In panels a, b, c and d, box lengths represent the IQR of the data, with whiskers depicting the lowest and highest values within 1.5 times the IQR of the first and third quartiles, respectively.
