
Extended Data Fig. 3. Comparison of the number of species recovered by each sampling strategy.
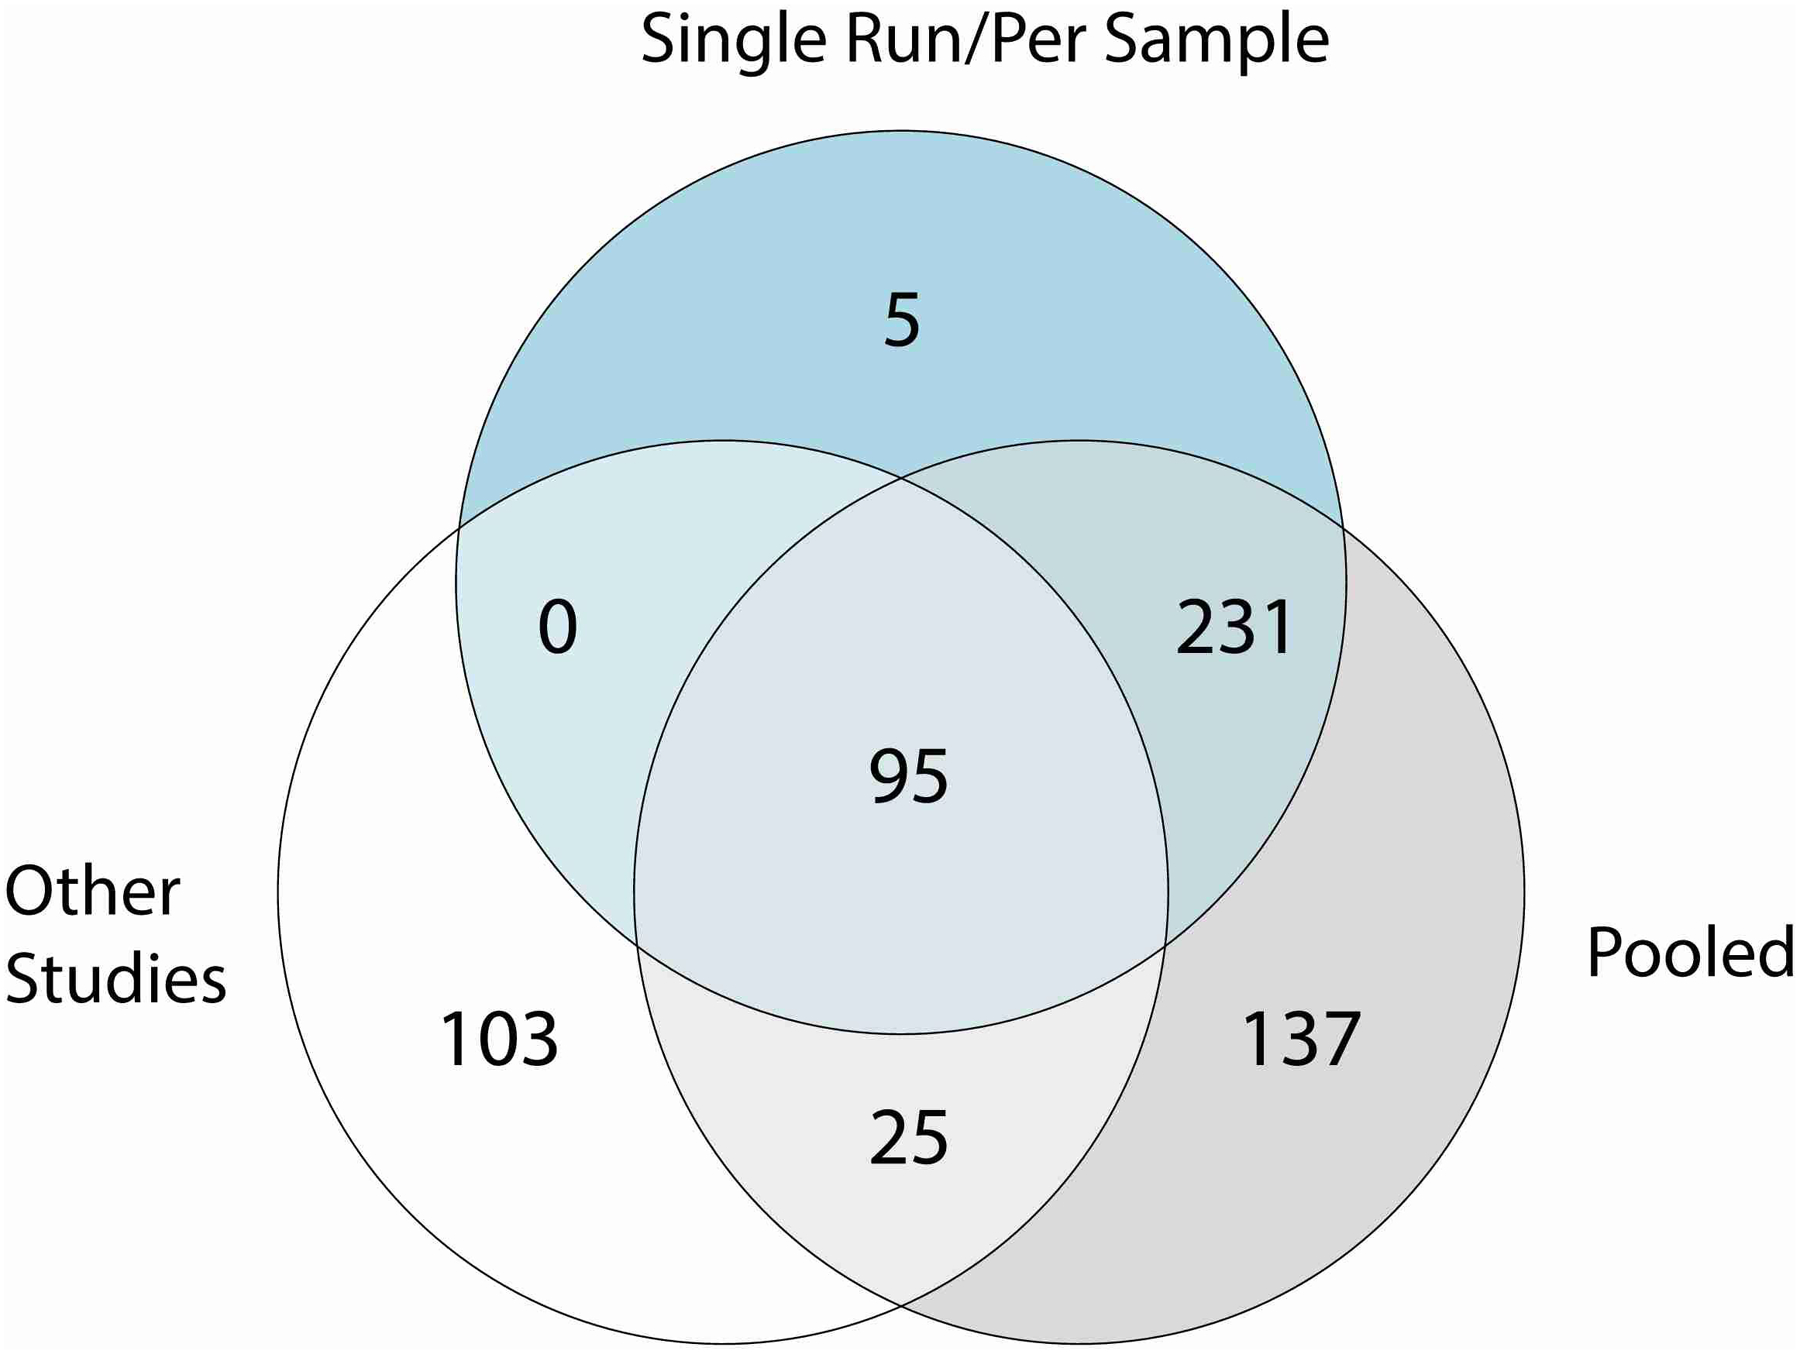
Venn diagram of the number of species recovered by single run/per sample and pooled approaches (Pool Time, Pool HV, Pool Site) as part of the study accession SRP002480 or by a per sample investigation of other publicly available metagenomic datasets (other studies).