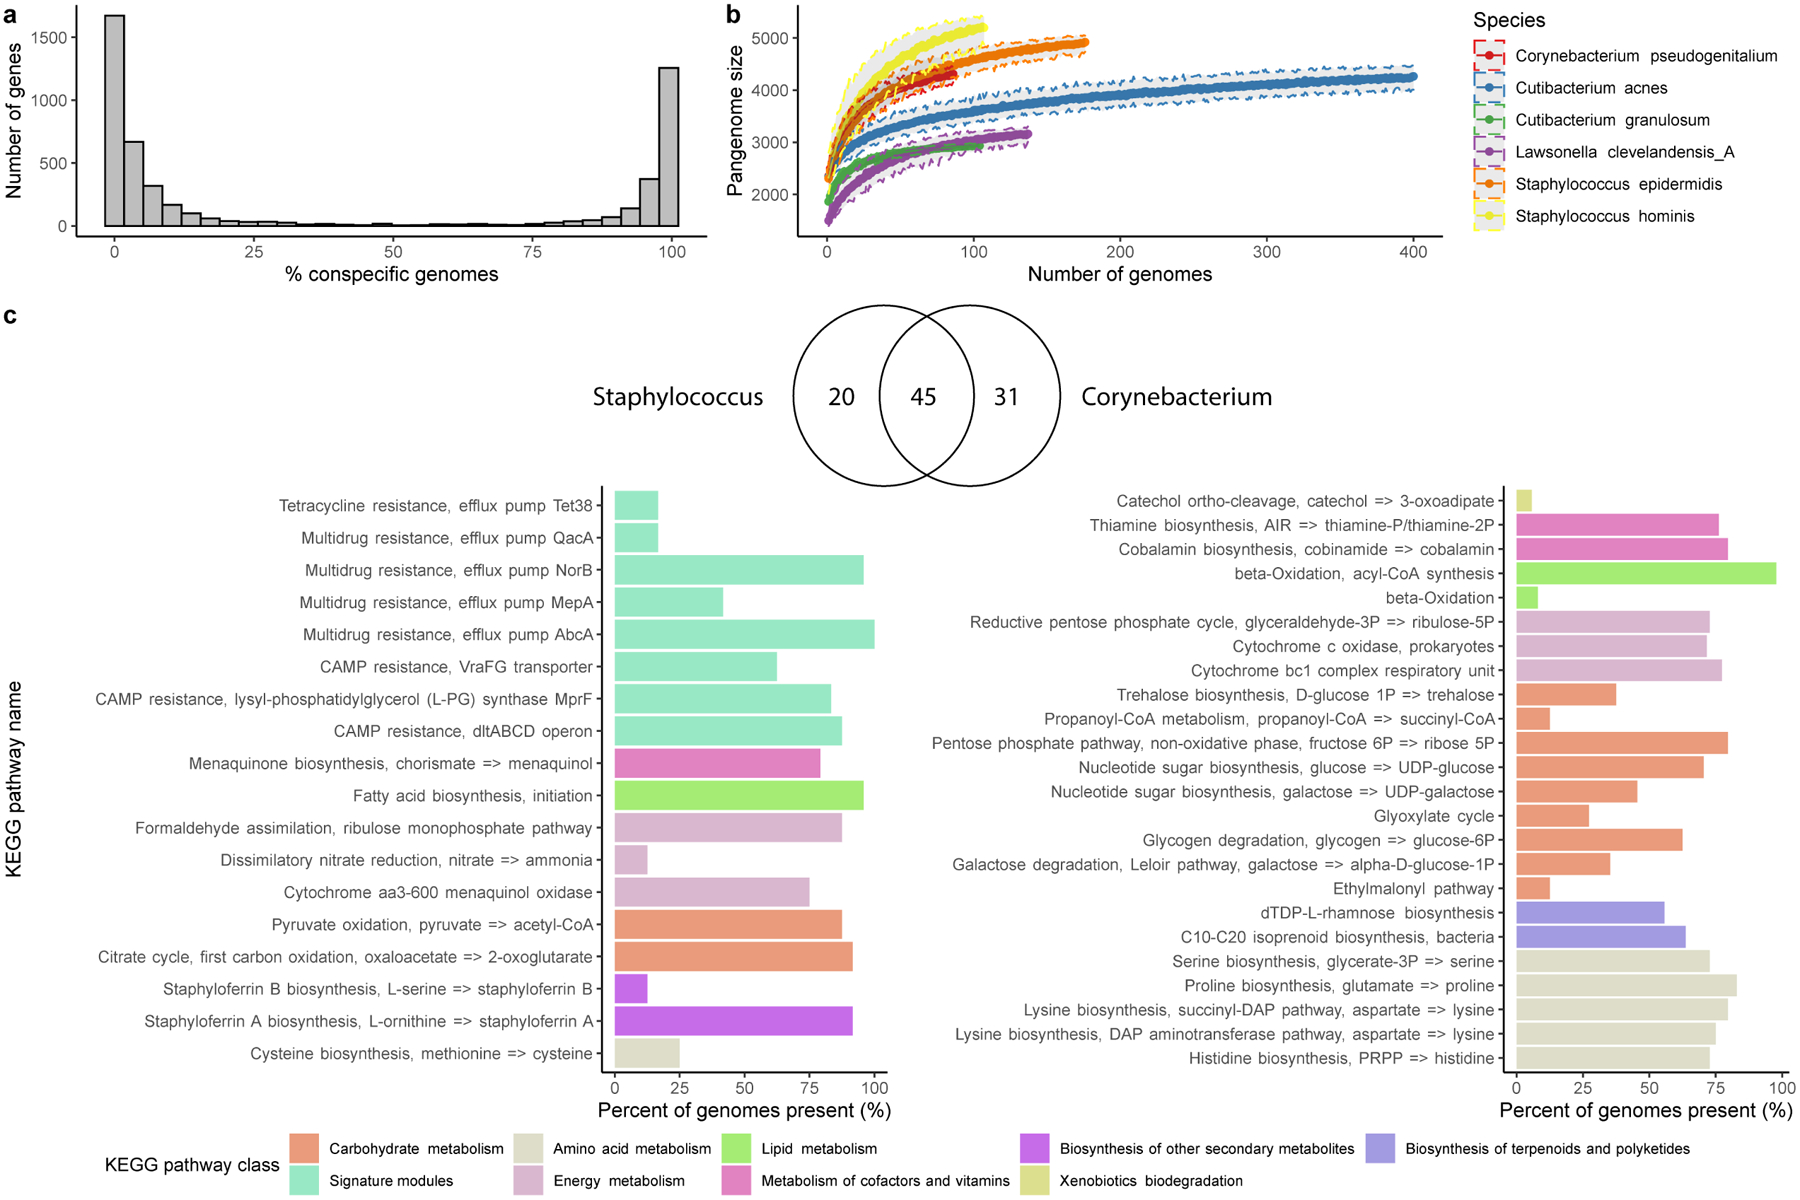
Extended Data Fig. 5. Gene frequency and metabolic pathway distribution of species from abundant skin genera.

a, Number of genes in relation to the number of near-complete (≥90% completeness) conspecific genomes recovered for Staphylococcus epidermidis. Other species showcased in b, showed similar distributions. b, Genome accumulation curves of the number of genes detected as a function of the number of non-redundant genomes analyzed. c, Venn diagram of the number of KEGG pathways shared by the two genera Staphylococcus and Corynebacterium. Barplot comparing the predominant KEGG pathways unique to the Staphylococcus or the Corynebacterium skin genomes only showing pathways present in at least 5% of the genomes.
