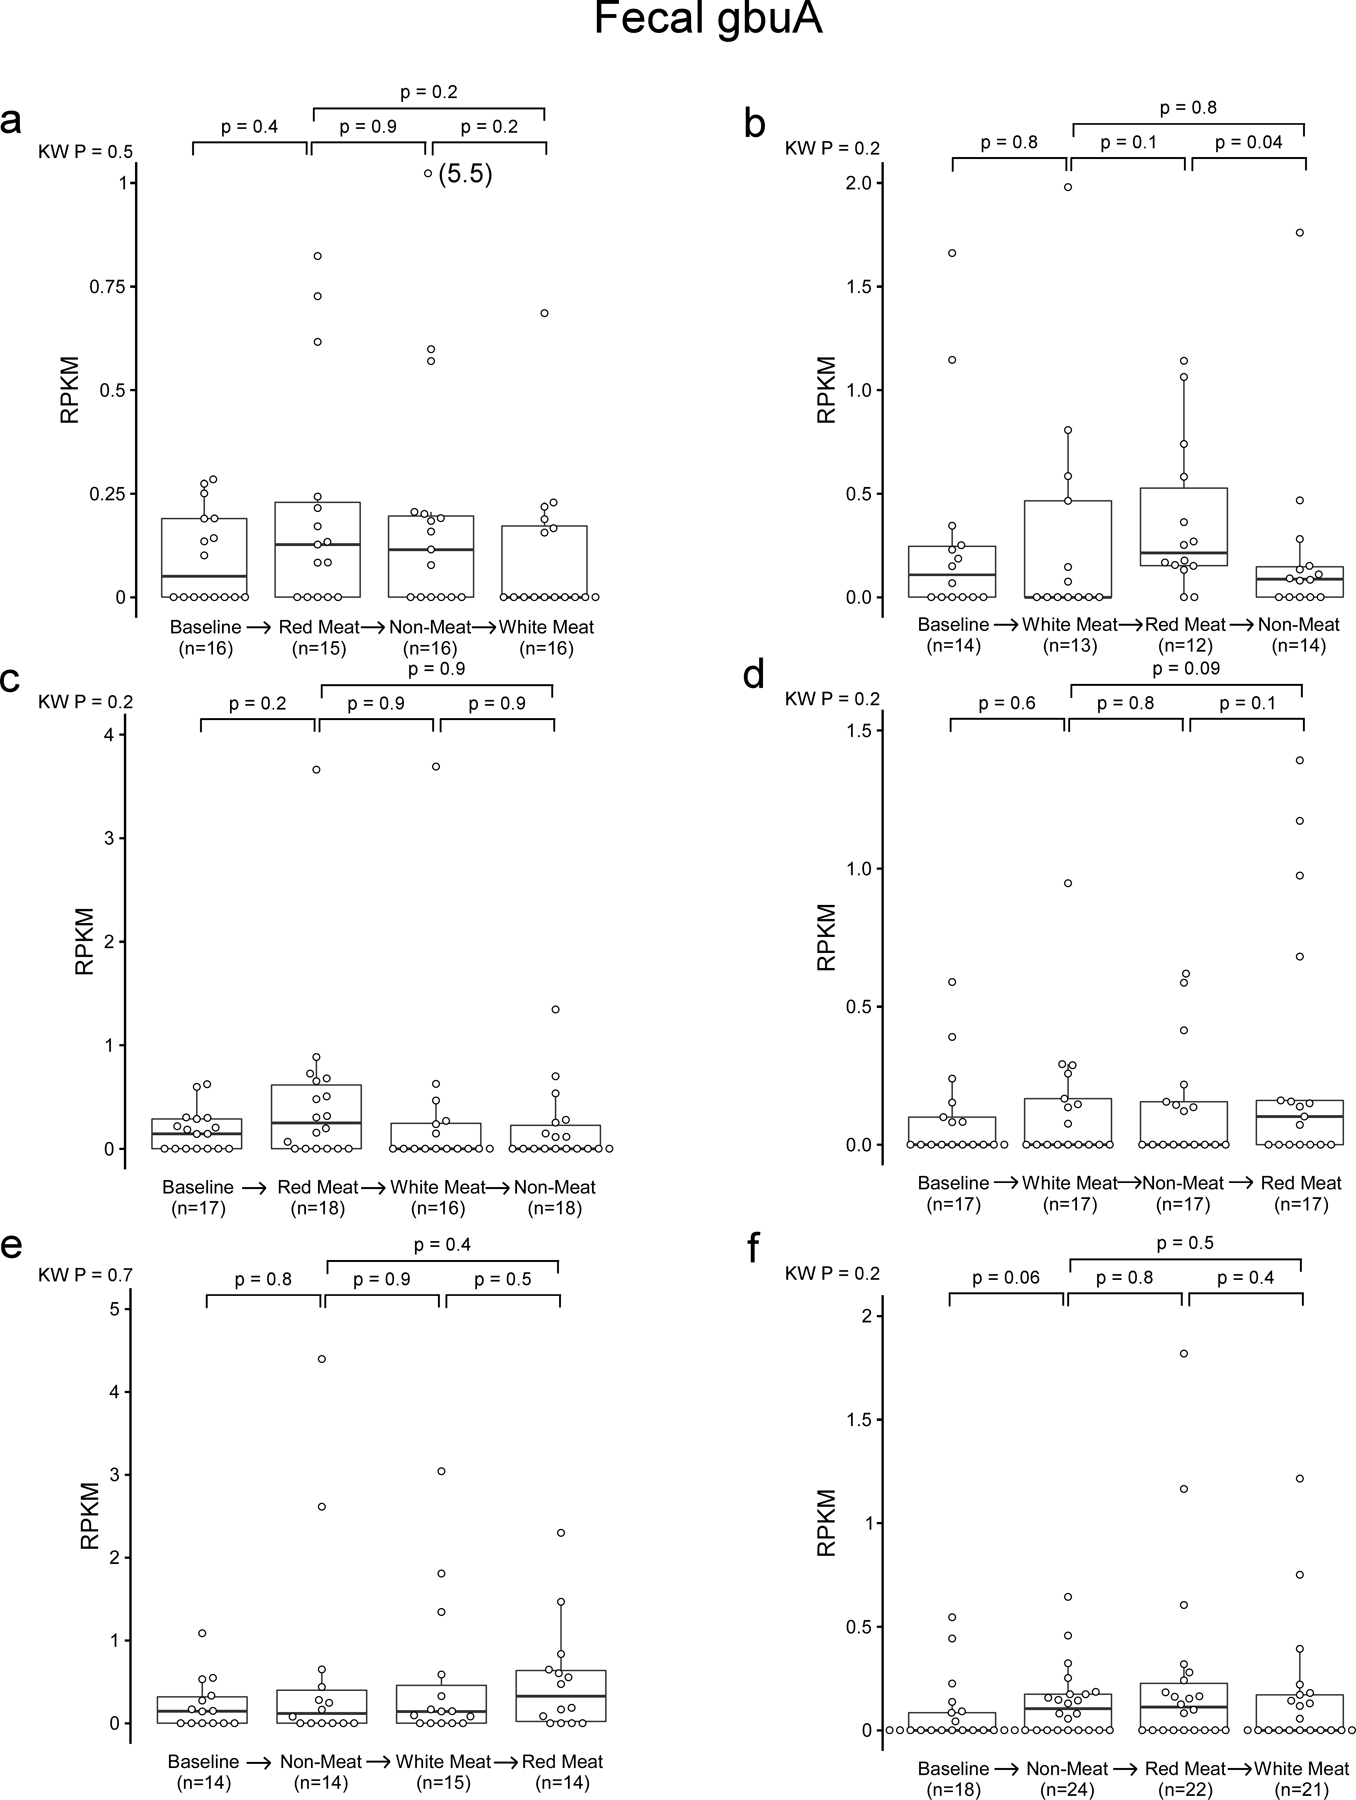
Extended Data Fig. 6. Fecal gbuA abundance in all diet order groups.

Using samples from the APPROACH study we assessed if gbuA abundance is regulated by diet. Participants were randomly assigned to consume red meat (highest L-carnitine containing diet, white meat, and non-meat (lowest L-carnitine containing diet) diets in one of six orders, with a washout period of at least two weeks between each diet intervention, as described under Methods. Using shotgun metagenomic sequencing gbuA abundance was calculated. In the box-whisker plot, the upper and lower boundaries of the box represent the 25th and 75th percentiles, the median is marked by a horizontal line inside the box, and whiskers extend to the largest or smallest point within 1.5 times the interquartile range of the 25th or 75th percentile. Values of outliers are shown in parenthesis next to the point. P values are determined by Kruskal-Wallis test (KW) or post-hoc Wilcox test.
