
Figure 2. Tox4 knockdown reduces gluconeogenesis and improves glucose tolerance.
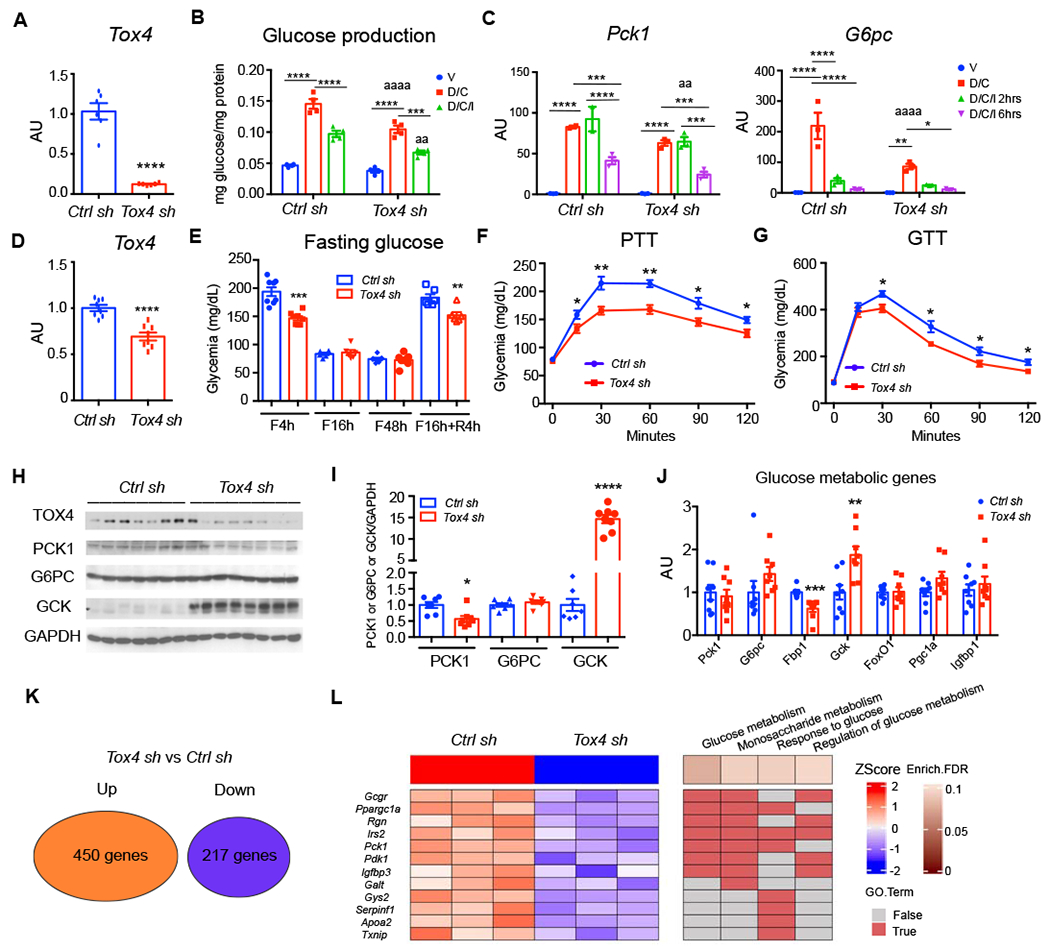
(A) Tox4 mRNA in primary hepatocytes following transduction with Ad-Tox4 shRNA (Tox4 sh, KD) or Ad-Ctrl shRNA (Ctrl sh) (n=6).
(B-C) Glucose production from pyruvate (B) (n=4), and Pck1 and G6pc mRNA (C) (n=3) in Ctrl or Tox4 sh-treated primary hepatocytes.
(D) Liver Tox4 mRNA. 10-week-old WT male mice received Ctrl sh (n=7) or Tox4 sh (n=8) and were killed after 2 weeks.
(E) Glucose levels in Ctrl sh- and Tox4 sh-treated mice at the indicated time points of fasting and refeeding.
(F) Pyruvate tolerance test (PTT) on day 6 post virus injection.
(G) Glucose tolerance tests (GTT) on day 12 post virus injection.
(H-I) WB (H) and quantification (I) of liver lysates from Ctrl sh- or Tox4 sh-treated mice after a 4-hr fast.
(J) Liver mRNA expression of glucose metabolic genes in Ctrl sh- or Tox4 sh-treated mice after 4-hr fasting;
(K) Summary of differentially expressed genes identified from RNA-seq of Ctrl sh- and Tox4 sh-treated livers (n=3 for each group). Log2FC>0.5 and FDR<0.1 were used to define the differentially expressed genes.
(L) Heatmap of down-regulated genes associated with glucose metabolism and their enriched biological processes (BPs) from gene ontology analysis.
* p<0.05, **/aa p<0.01, ***p<0.001, ****/aaaa p<0.0001. Asterisks indicate within group or Ctrl sh-treated mice comparisons, “a” indicate comparison with Ctrl sh group, by 2-tailed student’s t-test in A, D-K and 2-way ANOVA in B-C. Data are presented as means ± SEM.