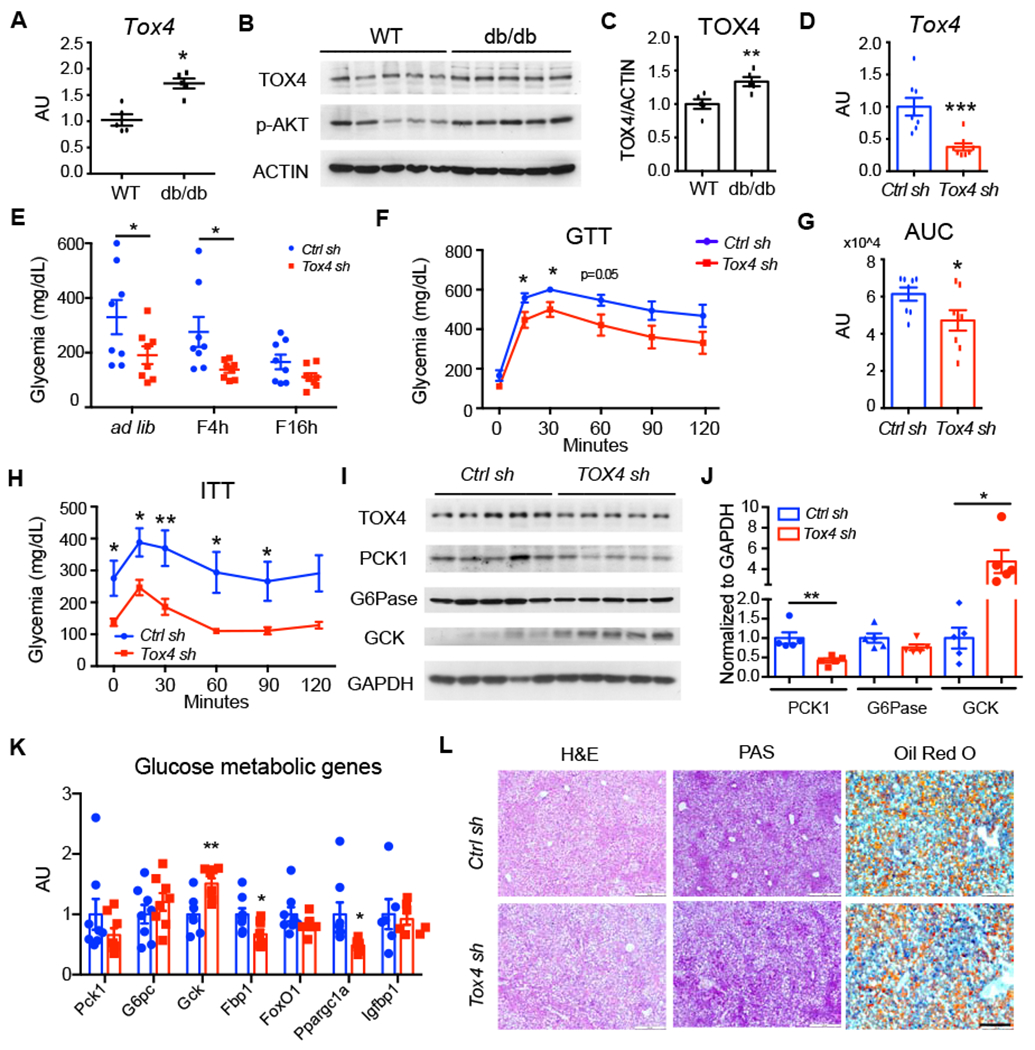
Figure 7. Silencing Tox4 ameliorates hyperglycemia and glucose intolerance in db/db mice.

(A-C) Liver Tox4 mRNA (A) and WB (B) with quantification (C) in 4-hr-fasted, 12-wk-old male WT and db/db mice.
(D-G) TOX4 inhibition in 12-week-old db/db male mice. Liver Tox4 mRNA (D); Blood glucose (E) (* p<0.05 by 2-way ANOVA); GTT (F) and AUC (G) at day 4 post viral injection; n=8 for each group.
(H) ITT at day 7 post viral injection. n=8 for each group.
(I-J) Hepatic protein levels were determined by WB (I) and quantification (J).
(K) Liver mRNA expression in mice killed at day 10 post virus transduction.
(L) Hematoxylin and eosin (H&E), PAS, and Oil Red O staining of liver sections from Ctrl sh and Tox4 sh treated db/db mice. Scale bar, 200 μm.
* p<0.05, ** p<0.01, *** p<0.001 compared with WT or Ctrl sh-treated mice, 2-tailed Student’s t-test. Data are presented as means ± SEM.
