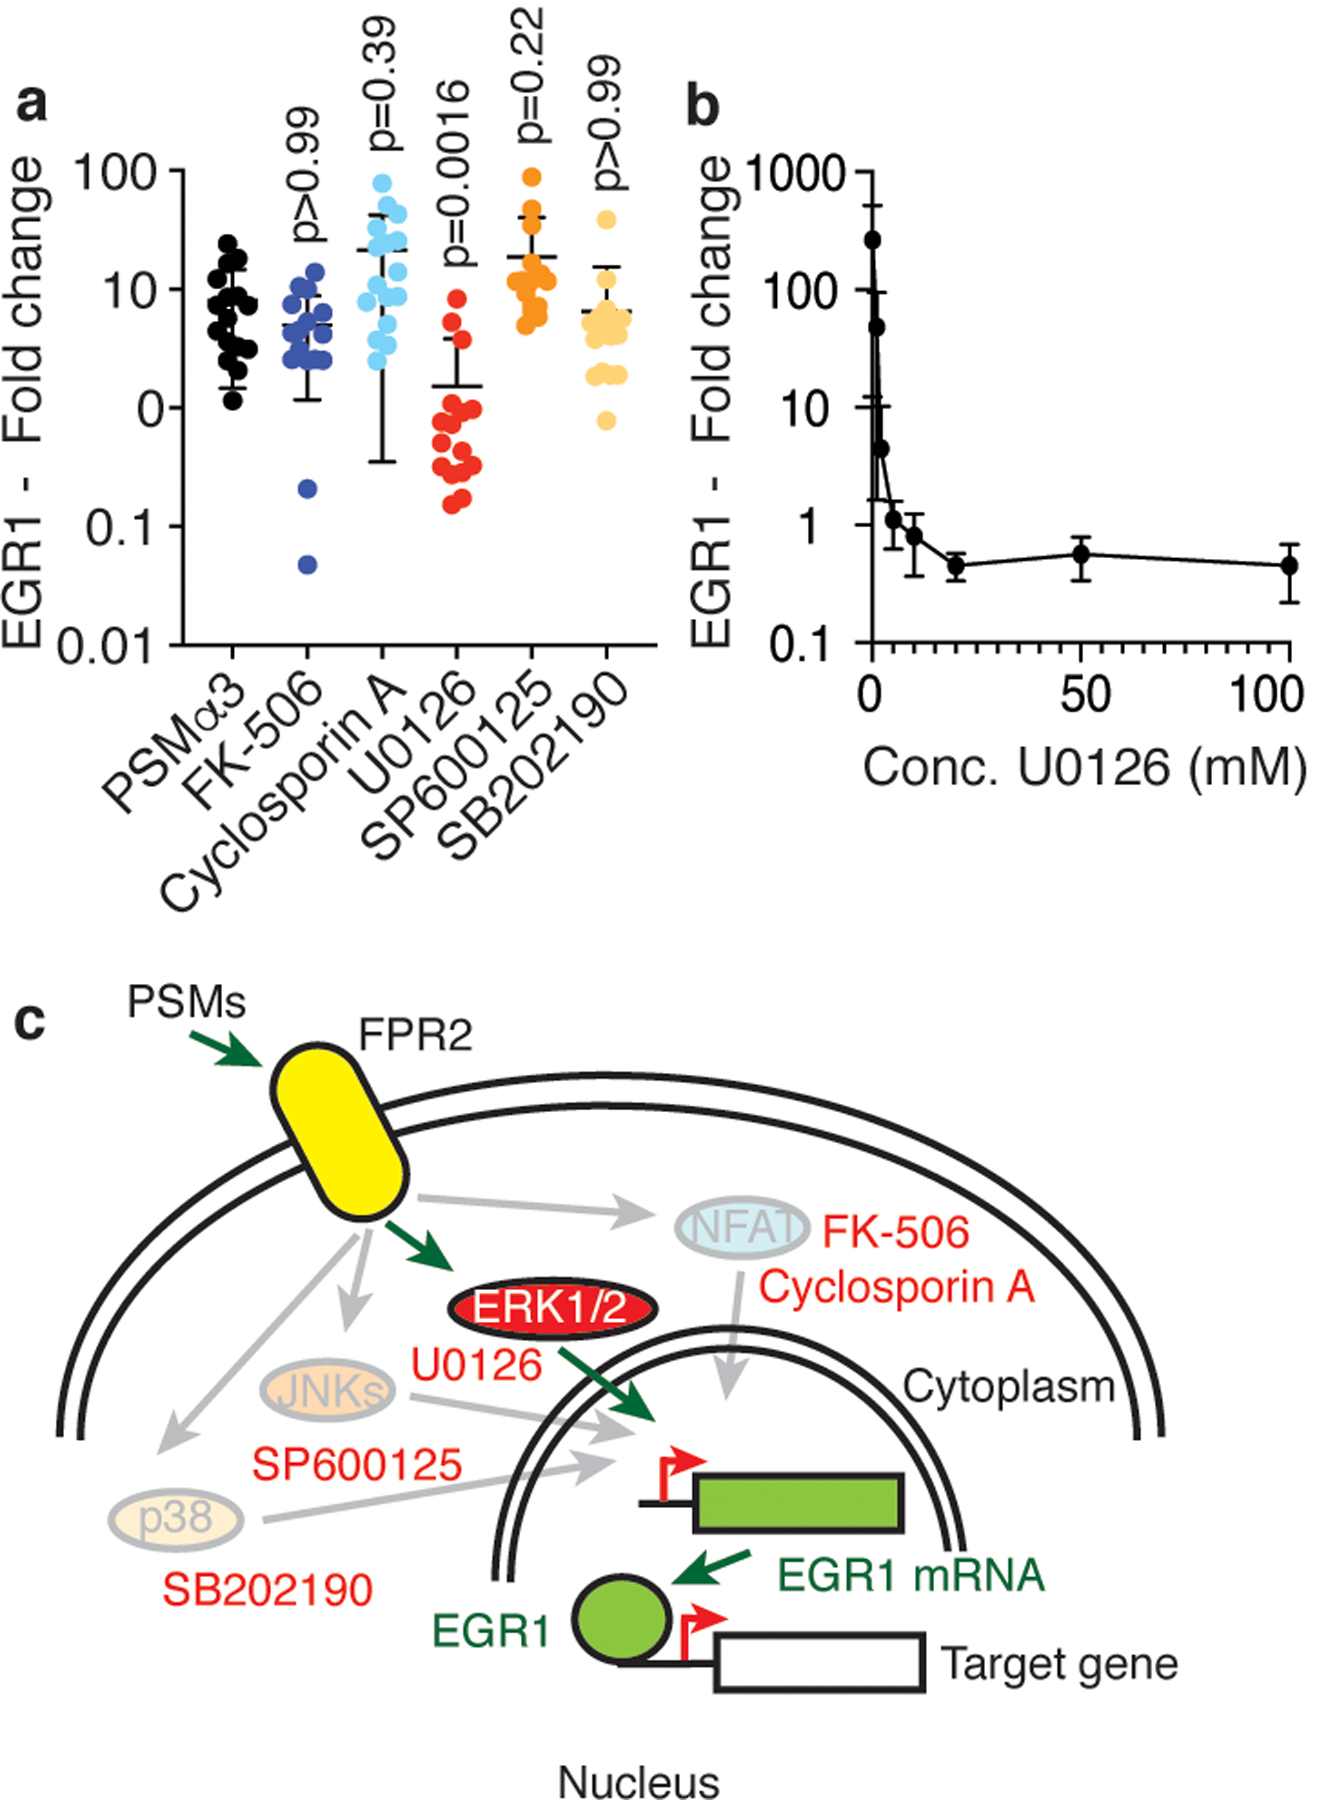
Figure 3. PSMs trigger EGR1 transcription via the MEK/ERK pathway.

a, Isolated human neutrophils (1 × 10⁷) were stimulated with synthetic PSMα3 (330 nM) diluted from a stock solution in DMSO for 30 min with or without addition of 10 μM of the indicated pathway inhibitors and EGR1 expression relative to a control that received equal amounts of DMSO was determined by qRT-PCR. n=16/group. Statistical analysis is by Kruskal-Wallis test with Dunn’s post-test vs. values obtained with PSMα3. b, Dose-response curve with different amounts of the MEK/ERK pathway inhibitor U0126 under the same conditions. n=3–5. c, Scheme of PSM-triggered signal transduction and tested pathways and their inhibitors (red font). Pathways that were not PSM-induced (not inhibited by the specific inhibitors) are shaded. a,b, Error bars show the mean ± SD.
