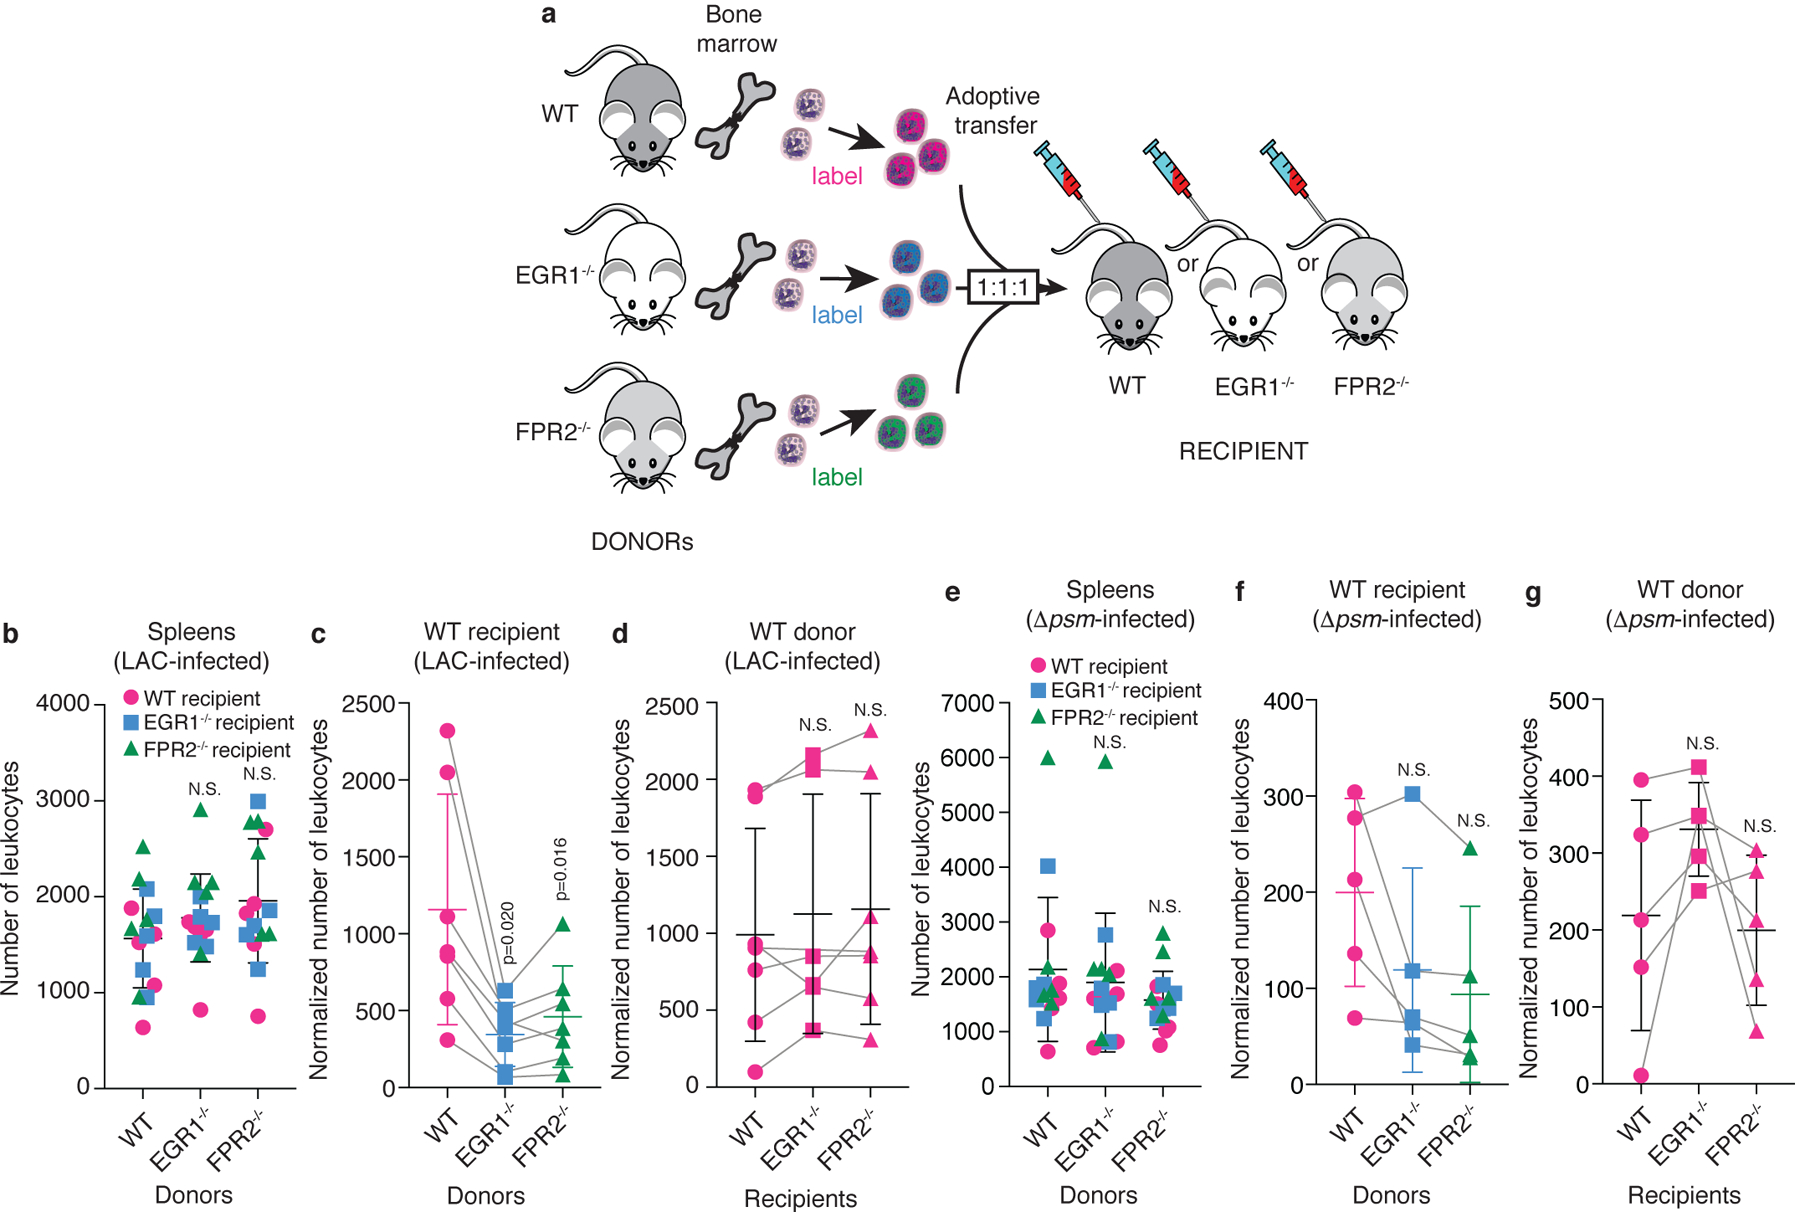
Figure 4. Leukocyte attraction via the FPR2-EGR1 pathway is direct and independent of resident skin cells.

a, Scheme of experimental setup. Leukocytes were obtained from the bone marrow of wild-type, FPR2−/−, and EGR1−/− mice, labeled with different fluorescent dyes, mixed in equal amounts, and injected into wild-type, FPR2−/−, or EGR1−/− recipient mice. Leukocyte infiltration to the site of infection was imaged by confocal microscopy 10 h post infection with Alexa Fluor 700 NHS ester-labeled S. aureus LAC or Δpsm and fluorescence due to infiltrated leukocytes was analyzed as described in Methods, which included normalization to leukocyte infiltration into the spleen. Bacterial inocula were set up to be in the range of 1 – 2 × 10⁷ CFU and actual injected bacterial CFU were determined in the inocula: LAC, 1.27 ± 0.31(SD) × 107; Δpsm, 1.46 ± 0.19 (SD) × 107. Note that the absolute numbers of leukocytes varied in the 1:1:1 mixes, and each adoptive transfer experiment represents a separate experiment in a different mouse, which were combined in the data shown in panels b-g. Therefore, influx numbers show wide variation between experiments. This was addressed by using matched data (repeated measures) analyses. b, Infiltration of leukocytes obtained from the bone marrow of wild-type, FPR2−/−, and EGR1−/− mice into the spleen (setup with LAC infection of ears, n=5 mice). c, Ear infiltration results obtained with different donor leukocytes in wild-type recipient mice, and d, wild-type donor leukocytes in different recipient mice with LAC-infected mice. n=6–7. (Note that in some mice, both ears were used, which is why there are corresponding spleen values from only 5 mice in panel b.) e-g, Corresponding experiments with Δpsm-infected mice. (e, n=5; f,g, n=5) b,e, Statistical analysis is by 1-way ANOVA with Dunnett’s post-test (b) or Kruskal-Wallis test with Dunn’s multiple comparison test (e) versus WT (wild-type) donor mice. c,d,f,g, Statistical analysis is by repeated measures 1-way ANOVA with Dunnett’s post-test versus WT. b-g, Error bars show the mean ± SD. For comparisons with mixed n, a mixed model (rather than ANOVA) was automatically employed by Prism. Grey lines connect matched values. See Extended Data Fig. 6 for exemplary confocal pictures and illustration of image processing, and Extended Data Fig. 7 for the corresponding analyses with FPR2−/− and EGR1−/− recipient mice.
