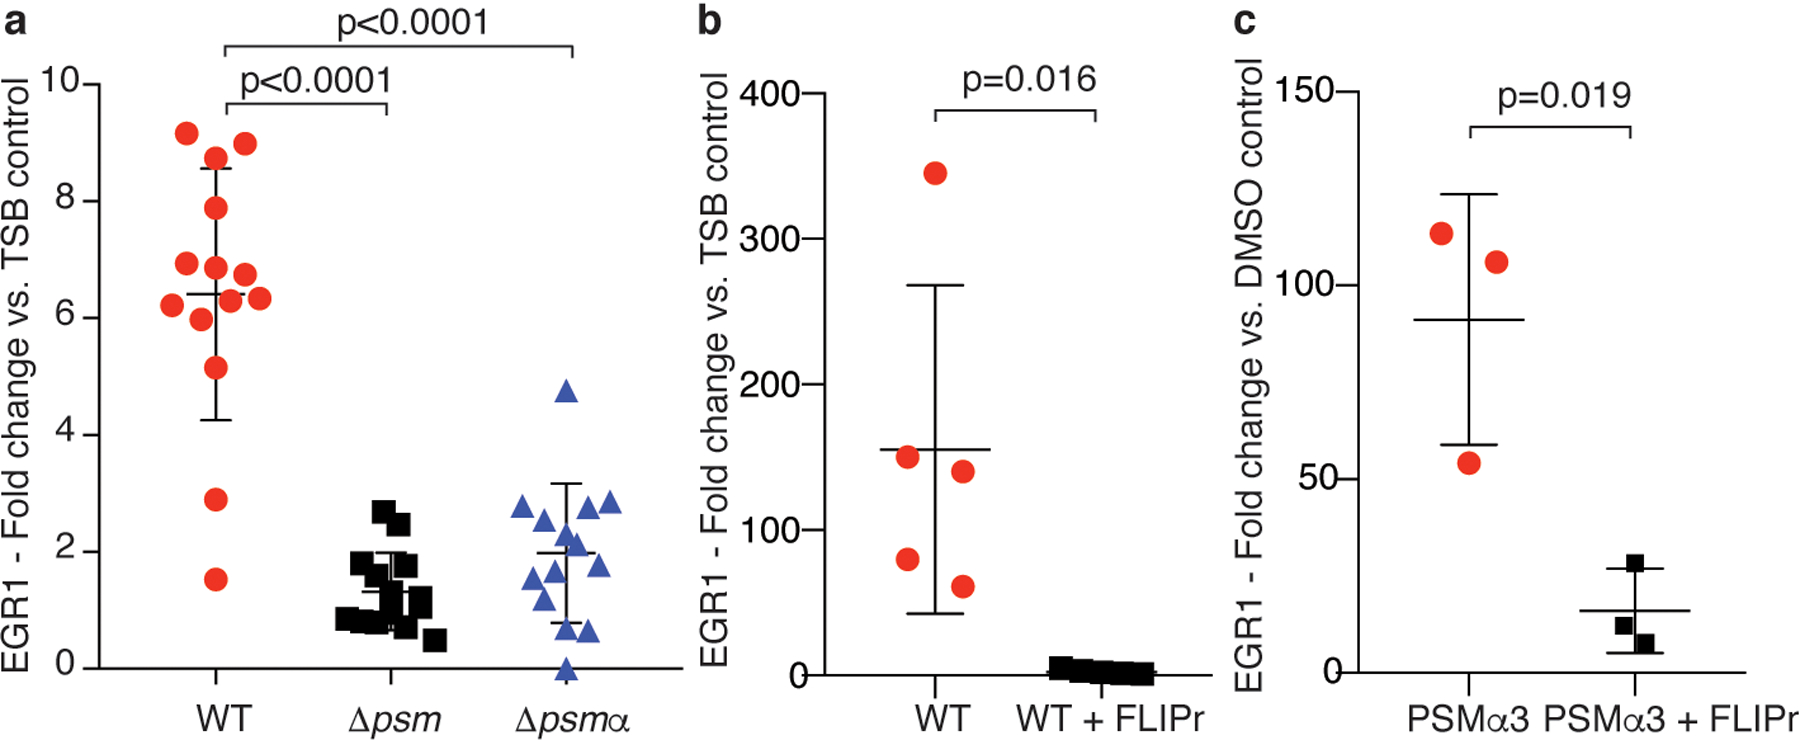
Extended Data Fig. 4. Verification of differential EGR1 expression in selected comparisons by qRT-PCR.

a, Comparison of the impact of diluted culture filtrates of S. aureus wild-type (WT) versus Δpsm and Δpsmα mutants on EGR1 expression in human neutrophils. Statistical analysis is by 1-way ANOVA with Tukey’s post-test. n=14. b, Impact of FLIPr on stimulation by S. aureus WT culture filtrate. n=5. c, Impact of FLIPr on stimulation by PSMα3. n=3. b,c, Statistical analysis is by two-tailed unpaired Student’s t-test. a-c, Error bars show the mean ± SD.
