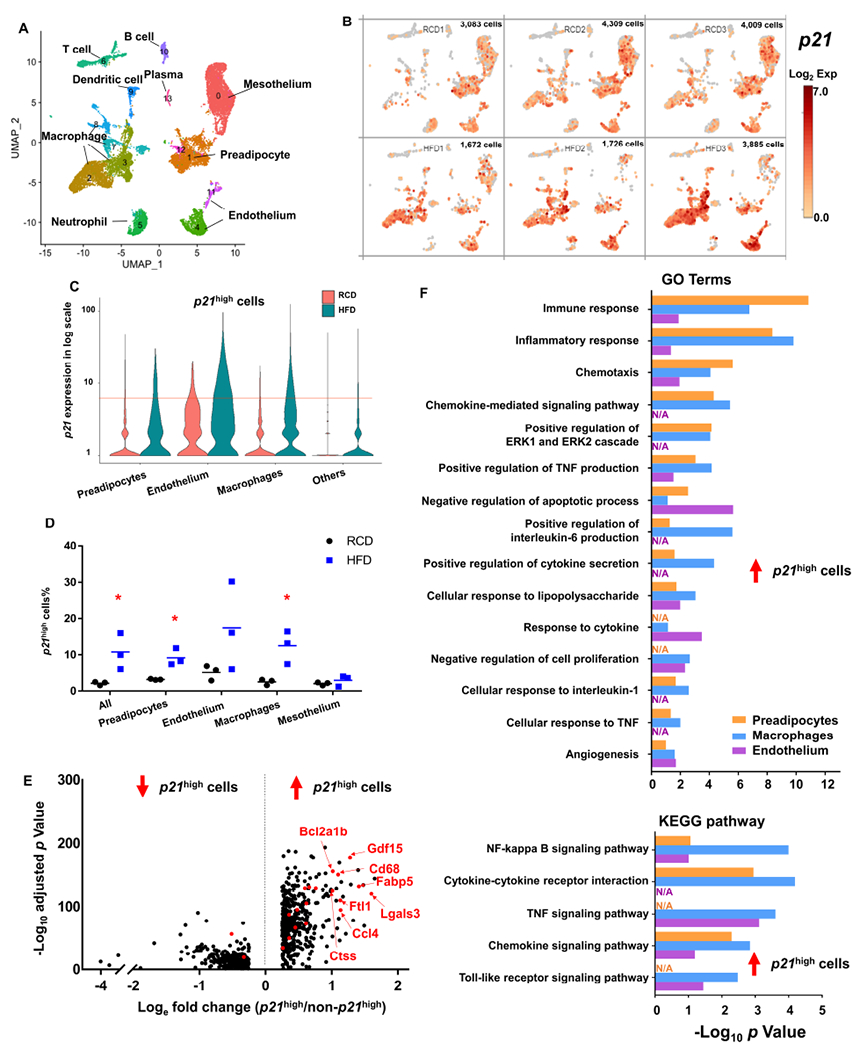
Figure 1. Single cell analysis of p21high cells in gVAT from lean and obese mice.

(A) Uniform manifold approximation and projection (UMAP) plot for unsupervised clustering of the single cells from SVF from RCD and HFD gVAT identified a total of 14 cell populations.
(B) UMAP plots showing log2 (normalized expression of p21) in RCD (upper) and HFD (bottom) mice. Each panel represented one mouse, and the number of single cells was shown on the top right of each panel.
(C) Violin plot of p21 expression in preadipocytes, endothelium, macrophages and others from RCD and HFD mice. Cells with p21 expression level > 6 (red line) were considered to be p21high.
(D) Proportion of p21high cells (p21 expression level > 6) in all cells, preadipocytes, endothelium, macrophages and mesothelium. n = 3 for both groups. n represents the number of biological replicates with 1 technical replicate. Results were shown as means ± s.e.m. *P < 0.05; two-tailed Welch’s t-test.
(E) Volcano plot of the down (left) and up-regulated (right) DEGs in p21high cells in all cell types. Overlapped DEGs among p21high preadipocytes, endothelium and macrophages are highlighted in red.
(F) Gene ontology (upper) and KEGG (bottom) analysis (https://david.ncifcrf.gov/) of the up-regulated DEGs in p21high cells of 3 cell types.
See also Figure S1.
