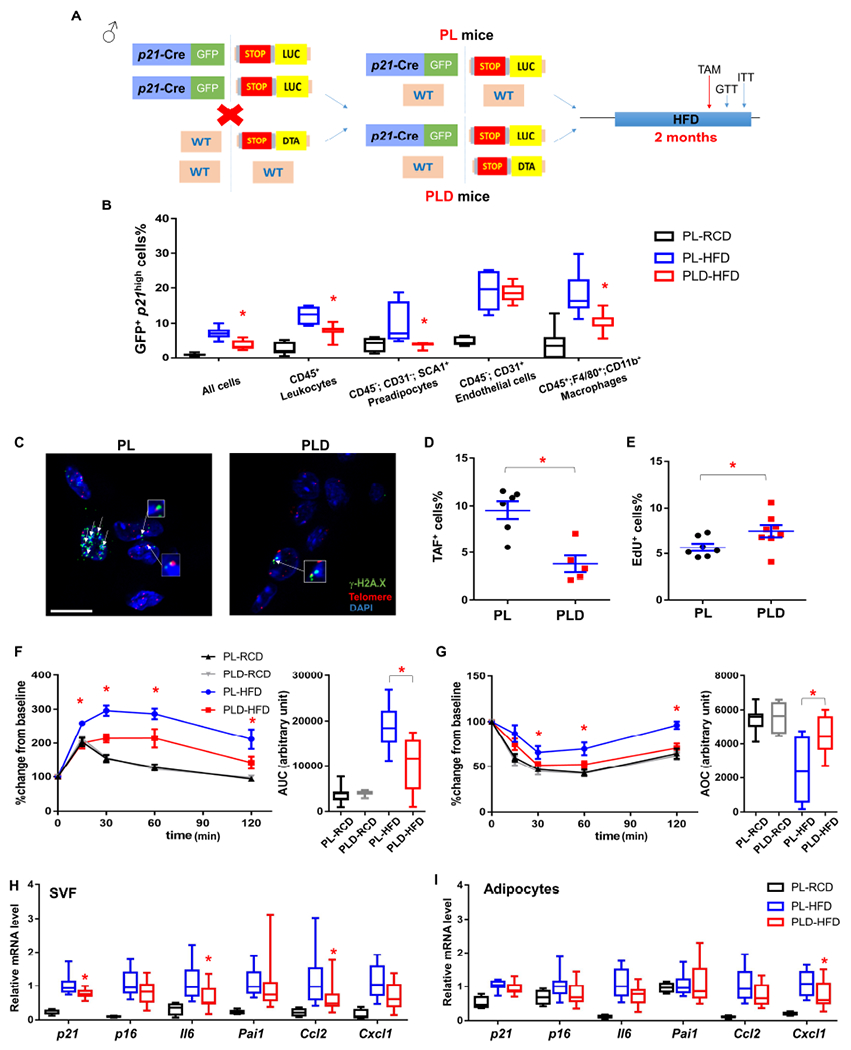
Figure 2. Clearance of p21high cells alleviates metabolic dysfunction from 2 months of HFD.

(A) Genetic crosses and experimental design.
(B) Percent of cells that are GFP+ across different cell types within gVAT.
(C) Representative TAF images (4-5 images per biological replicate). A single layer obtained from z-stacks with 20+ layers is shown. TAFs are indicated by white arrows. Gamma H2A.X (green), Telomere probe (red), DAPI (blue). Cells are considered to be TAF+ if they contain no less than 3 TAFs from the entire z-stacks. Scale bar = 10 μm.
(D) Proportion of TAF+ cells.
(E) Proportion of EdU+ cells.
(F) GTT curve (mean ± s.e.m.) and area under curve (AUC), (G) ITT curve (mean ± s.e.m.) and area over curve (AOC) in PL and PLD mice.
(H) Relative mRNA expression in SVF.
(I) Relative mRNA expression in adipocytes.
For B, n = 7 for all groups. For D, n= 6 for PL, n = 5 for PLD. For E, n = 7 for PL, n = 8 for PLD. For F and G, n = 7 for PL-RCD and PLD-RCD; n = 8 for PL-HFD and PLD-HFD. For H and I, n = 4 for PL-RCD, n = 11 for PL-HFD and PLD-HFD. For B, E-I, n represents the number of biological replicates with 1 technical replicate. For D, n represents the number of biological replicates with 2-5 technical replicates. Results were shown as mean ± s.e.m. or box-and-whisker plots, where a box extends from the 25th to 75th percentile with the median shown as a line in the middle, and whiskers indicate the smallest and largest values. *P < 0.05 vs PL-HFD by one-way ANOVA (B, H-I), by two-way ANOVA (F-G), or by two-tailed Welch’s t-test (D-E).
