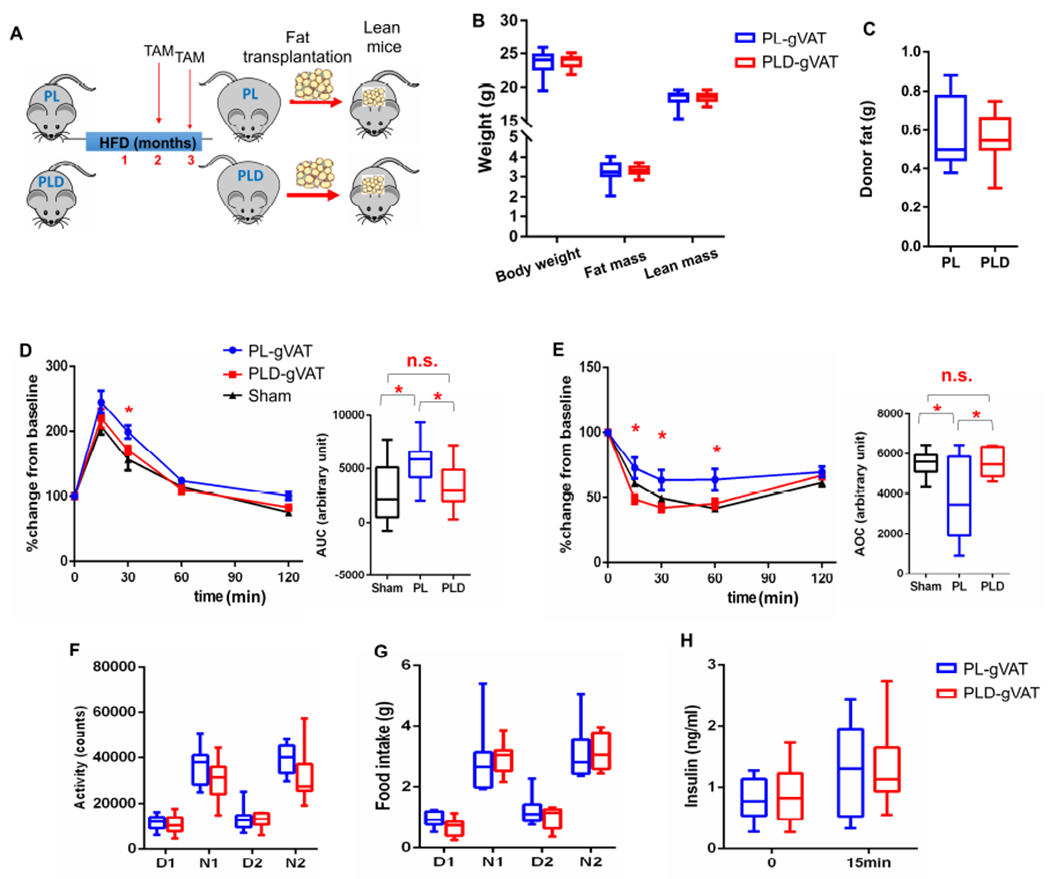
Figure 6. Elimination of p21high cells in gVAT is sufficient to alleviate obesity-induced metabolic dysfunction.

(A) Schematic of mouse gVAT transplantation experiments.
(B) Body composition.
(C) Donor fat weight 2 months after transplantation.
(D-E) GTT curve (mean ± s.e.m.) and AUC (D), ITT curve (mean ± s.e.m.) and AOC (E) in lean mice transplanted with no tissue (Sham), gVAT from PL mice (PL-gVAT), and gVAT from PLD mice (PLD-gVAT).
(F-G) Activity (F) and food intake (G) during daytime (D) and night (N) for 2 days.
(H) Plasma insulin at baseline and 15 minutes after glucose injection.
For B, C, H, n = 10 for both groups. For D and E, n = 8 for Sham, n = 10 for PL-gVAT, n = 10 for PLD-gVAT. For F, G, n = 8 for both groups. For B-H, n represents the number of biological replicates with 1 technical replicate. Results were shown as box-and-whisker plots, where a box extends from the 25th to 75th percentile with the median shown as a line in the middle, and whiskers indicate the smallest and largest values, n.s, no significance vs Sham by one-way ANOVA (D, E). *P < 0.05 vs PL by two-way ANOVA (GTT and ITT curves), or by one-way ANOVA (AUC and AOC).
See also Figure S7.
