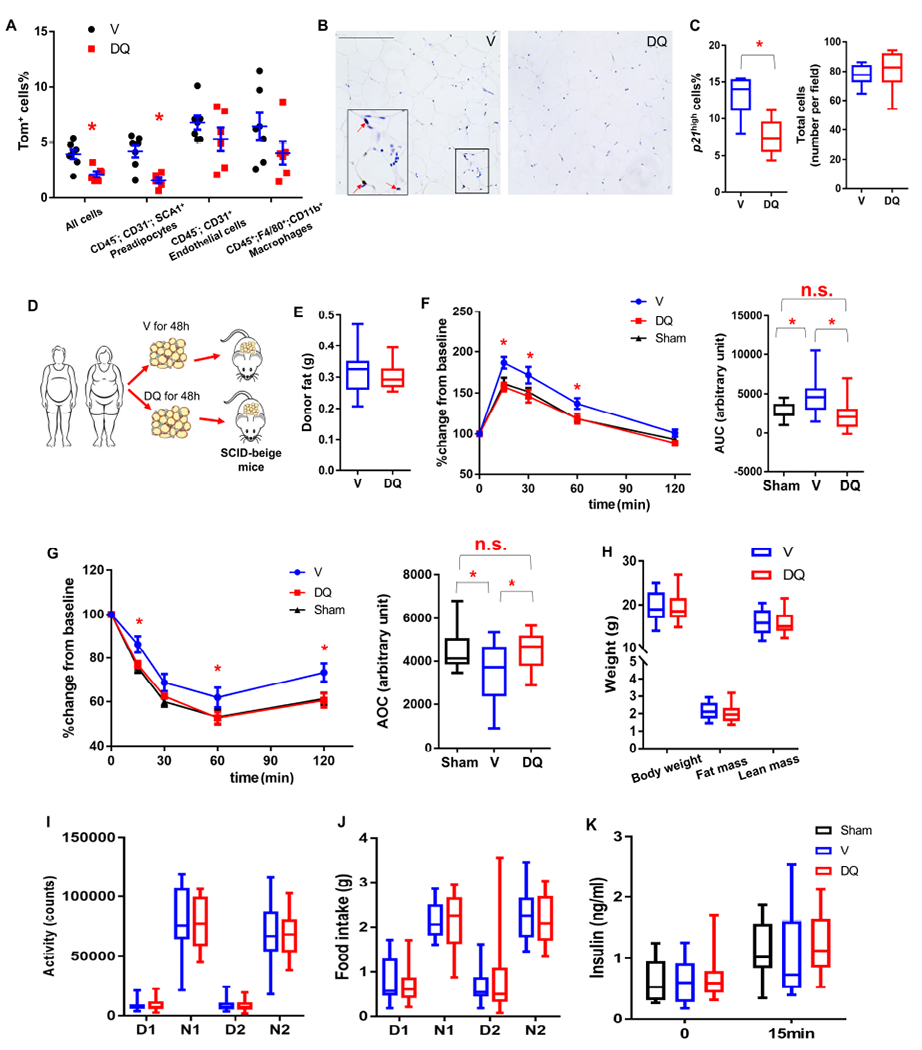
Figure 7. Pharmacological elimination of p21high cells in VAT from humans with obesity alleviates its harmful effect on metabolic function in mice.

(A) Proportion of Tom+ cells in different cell types in gVAT from HFD-fed PT mice treated with D+Q (DQ) or vehicle (V).
(B) Representative p21 staining micrographs of human VAT explants treated with DMSO (V) or D+Q (DQ) (3 images per 8 biological replicates in each group). Red arrows indicate p21high cells. Scale bar = 250 μm.
(C) Percent of cells that are p21high cells among all cells and total cell number/field.
(D) Experimental design for human VAT transplantation.
(E) Human donor fat weight 2 months after transplantation.
(F-G) GTT curve (mean ± s.e.m.) and AUC (F), ITT curve (mean ± s.e.m.) and AOC (G) in SCID-Beige mice transplanted with no tissue (Sham), VAT explants from humans with obesity treated with DMSO (V) or D+Q (DQ).
(H) Body composition.
(I-J) Activity (I) and food intake (J) during daytime (D) and night (N) for 2 days.
(K) Plasma insulin at baseline and 15 minutes after glucose injection.
For A, n = 7 for V, n = 6 for DQ. Results were shown as means ± s.e.m. For C, n = 8 for both groups. For E-K, n = 12 for Sham, n = 13 for V, n = 14 for DQ. For A, C, E-H, n represents the number of biological replicates with 1 technical replicate. Results were shown as box-and-whisker plots, where a box extends from the 25th to 75th percentile with the median shown as a line in the middle, and whiskers indicate the smallest and largest values. n.s, no significance vs Sham by one-way ANOVA (F-AUC, G-AOC). *P < 0.05 vs V by two-tailed Welch’s t-test (A, C), by one-way ANOVA (F, G), or by two-way ANOVA (GTT and ITT curves).
