. 2021 Oct 28;82(1):25–35. doi: 10.1158/0008-5472.CAN-21-1207

Figure 1.

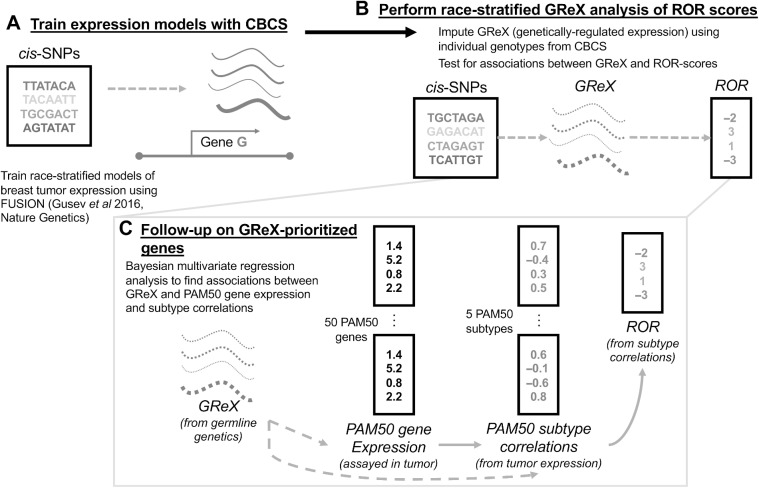
Figure 1. Schematic of study analytic approach. A, In CBCS, constructed race-stratified predictive models of tumor gene expression from cis-SNPs. B, In CBCS, imputed GReX at individual level using genotypes and tested for associations between GReX and CRS in race-stratified linear models; only GReX of genes with significant cis-h2 and high cross-validation performance (R2 > 0.01 between observed and predicted expression) considered for race-stratified association analyses. C, Follow-up analyses on GReX-prioritized genes (i.e., genes whose GReX were significantly associated with CRS at FDR < 0.10). In race-stratified models, PAM50 SCCs and PAM50 tumor expressions were regressed against GReX-prioritized genes under a Bayesian multivariate regression and multivariate adaptive shrinkage approach.

Schematic of study analytic approach. A, In CBCS, constructed race-stratified predictive models of tumor gene expression from cis-SNPs. B, In CBCS, imputed GReX at individual level using genotypes and tested for associations between GReX and CRS in race-stratified linear models; only GReX of genes with significant cis-h2 and high cross-validation performance (R2 > 0.01 between observed and predicted expression) considered for race-stratified association analyses. C, Follow-up analyses on GReX-prioritized genes (i.e., genes whose GReX were significantly associated with CRS at FDR < 0.10). In race-stratified models, PAM50 SCCs and PAM50 tumor expressions were regressed against GReX-prioritized genes under a Bayesian multivariate regression and multivariate adaptive shrinkage approach.