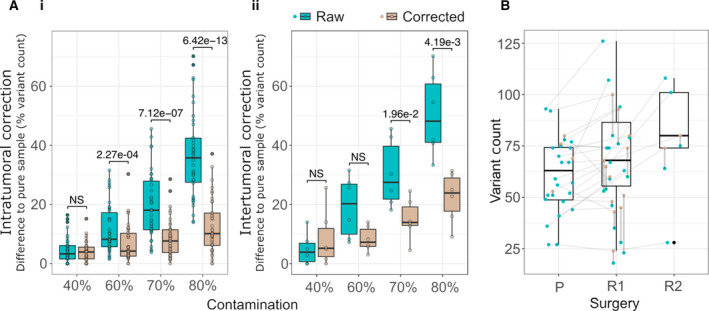
Fig. 3.

Assessment of purity adjustment on simulated and patient data. (A) Difference in variant count relative to the pure sample for each level of simulated impurity before (green) and after (brown) the correction model is applied. The pure data were tested using (i) intrasample correction and (ii) intersample correction. Whether mean error was reduced after correction was assessed by way of a paired, one‐tailed t‐test, and comparisons are annotated either as not significant (NS) or with their resulting P‐value. (B) TMB of GBM samples at presentation (P), first relapse (R1), and second relapse (R2). Uncorrected (green) and corrected (brown) TMB values are shown for each specimen and joined by a vertical line. Specimens from a single patient are connected with a horizontal line. A summary of the cTMB values is shown as boxplots. The box plot shows the 25%, 50%/median, and 75% quantile.
