
Fig. 6.
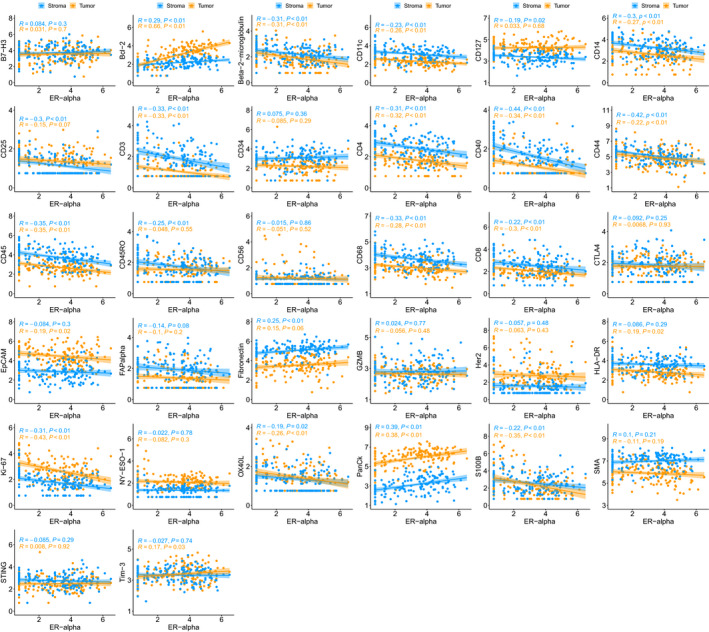
Correlation plots of log2‐transformed DSP data depicting the relationship between ER and other analytes in the panel. Most immune analytes are inversely associated with ER in both the tumor and stromal compartments. The Pearson correlation coefficient (R) and corresponding P‐value for testing the hypothesis that true correlation is 0 are shown.