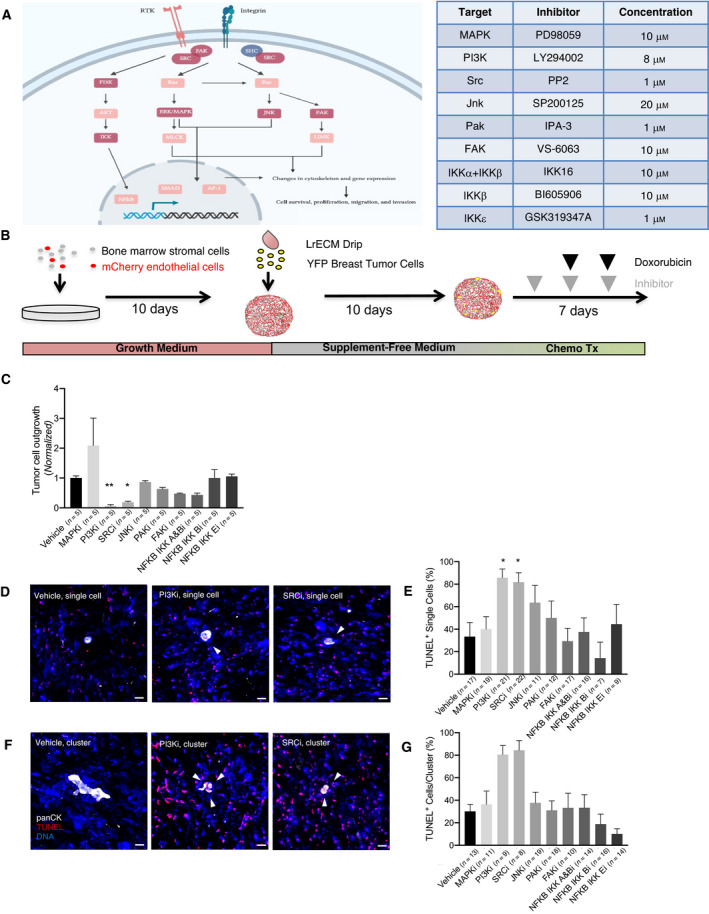
Fig. 1.

Probing signaling downstream of integrin‐β1 suggests PI3K and Src as therapeutic targets. (A) Canonical integrin signaling pathways, with key nodes highlighted in dark red. Signaling pathway adapted from reference [18]. Inhibitors targeting indicated nodes are listed in the accompanying table, along with the doses used for in vitro treatment in our study. (B) Schematic of bone marrow microvascular niche (bm‐MVN) culture experiments to determine the effect of targeting downstream integrin signaling. HMT‐3522‐T4‐2s were seeded onto bm‐MVNs and dosed with small molecule inhibitors. (C) PI3K inhibition significantly decreased tumor cell outgrowth (P = 0.0024), as did Src inhibition (P = 0.0138). Following completion of the experiment, cultures were TUNEL‐stained to determine tumor cell apoptosis. A Kruskal–Wallis test comparing data from five replicates was used here. Outgrowth is normalized to vehicle. Error bars represent SEM. (D) Representative images of TUNEL‐stained single tumor cells on bm‐MVNs treated with DMSO (vehicle), PI3K inhibitor (LY294002), or SRC inhibitor (PP2) followed by doxorubicin. Scale bar = 20 μm. White arrows indicate TUNEL‐positive apoptotic tumor cells. (E) Quantification of the percentage of TUNEL‐positive single tumor cells. PI3K and SRC inhibition significantly increased apoptosis in single cells (P = 0.018 and P = 0.035, respectively) when compared to vehicle via Kruskal–Wallis test. n = 7–22 single cells analyzed per condition. Error bars represent SEM. (F) Representative images of TUNEL‐stained 2–4 cell clusters treated with DMSO, PI3K, or SRC inhibitors. (G) Quantification of the percentage of TUNEL‐positive clusters of tumor cells. Kruskal–Wallis test shows PI3K inhibition increases apoptosis in 2–4 cell clusters (P = 0.006), as does SRC inhibition (P = 0.005), when compared to vehicle. n = 8–19 clusters analyzed per condition. Error bars represent SEM.
