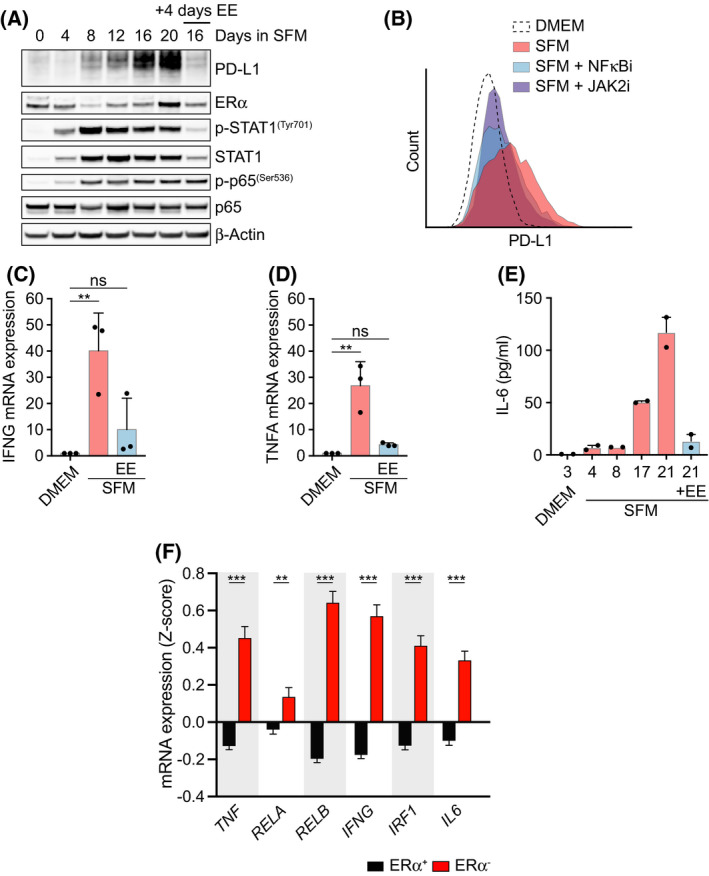
Fig. 3.

Estrogen signaling suppresses an inflammatory phenotype in MCF7 cells. (A) Whole‐cell lysates from MCF7 cells cultured in SFM for the specified days were analyzed by WB using the indicated antibodies. Where indicated, 10 nm EE was added at 16 days for the final 4 days. Total p65 and β‐Actin served as loading controls. (B) Flow cytometry‐mediated evaluation of PD‐L1 membrane levels in MCF7 cells grown in DMEM or SFM for 21 days, alone or in combination with the NF‐kB inhibitor CAPE (10 μm) or JAK2 inhibitor CEP‐33779 (10 μm) for the last 3 days. Representative data from 3 experiments are shown. (C, D) qRT‐PCR analysis (n = 3) of IFN‐γ (IFNG) (C) or TNF‐α (TNFA) (D) mRNA levels in MCF7 cells cultured as in (A). 18S rRNA was used as an internal control. (E) Levels of IL‐6 in the supernatant of MCF7 cells cultured in DMEM or SFM for the specified days as measured in duplicates by LEGENDplex‐FACS (see Materials and methods). Where indicated, EE (10 nm) was added at day 17 for the last 4 days. (F) TNF, RELA, RELB, IFNG, IRF1, and IL6 mRNA expression levels in ERα+ (n = 1459) and ERα− (n = 445) patient samples. Normalized Z‐scores were extracted from the METABRIC dataset [22]. Data are presented as mean ± SEM, and two‐tailed Student's t‐test was used to calculate the statistical significance. **P < 0.01 and ***P < 0.001.
