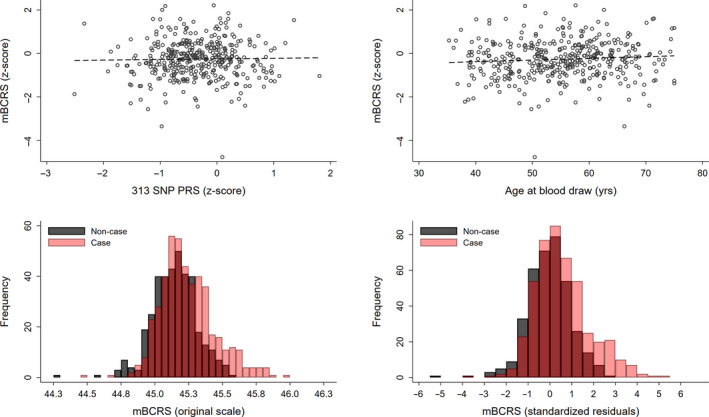
Fig. 1.

mBCRS correlations with 313 SNP PRS and age and mBCRS distributions in the Sister Study testing set. Among women sampled as part of the random subcohort and selected into the testing set (n = 375), scatterplot and fit line between mBCRS values and the 313 SNP PRS (Pearson’s correlation: 0.03, top left panel); and scatterplot and fit line between mBCRS and age at blood draw (Pearson’s correlation: 0.09, top right panel). The distribution of mBCRS on the original scale ranged from 44.28 to 45.96, with a mean of 45.20 (SD = 0.19); women who remained cancer‐free had a mean of 45.14 (SD = 0.17), those who developed breast cancer had a mean of 45.24 (SD = 0.20) (bottom left panel). The standardized residuals for mBCRS ranged from −5.30 to 5.20, with a mean of 0.30 (SD = 1.19); women who remained cancer‐free had a mean of −0.03 (SD = 0.99), and those who developed breast cancer had a mean of 0.56 (SD = 1.27) (bottom right panel).
