
Fig. 2.
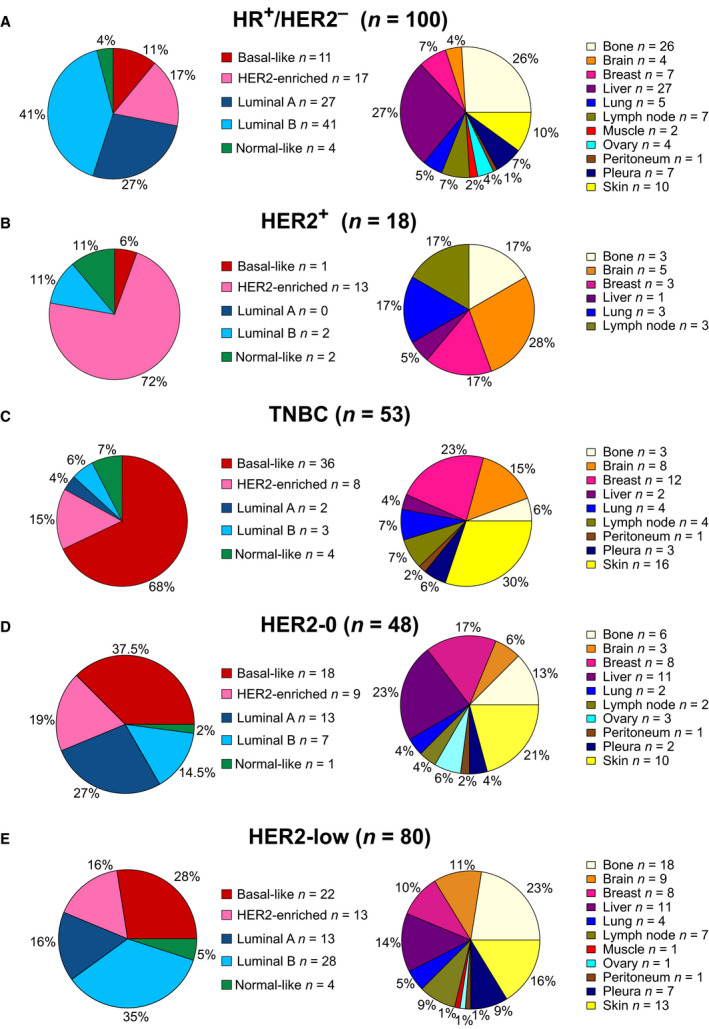
PAM50 subtype and metastatic site distribution in each IHC group. Pie charts depicting the percentage of each PAM50 subtype and the percentage of each metastatic site in (A) HR+/HER2‐negative, (B) HER2+, (C) TNBC, (D) HER2‐0, and (E) HER2‐low tumors.