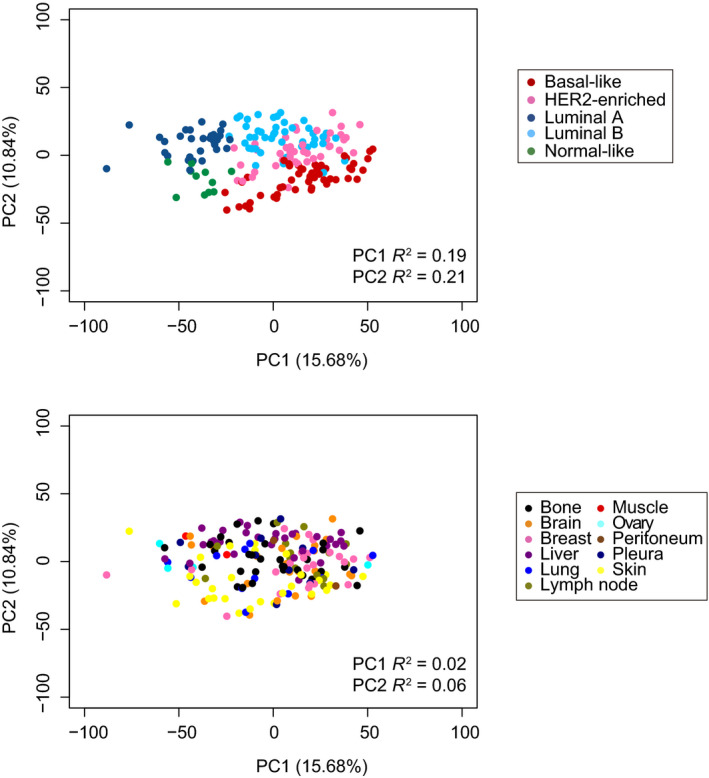
Fig. 4.

Principal component analysis. Unsupervised PCA of 181 metastatic samples with coloring of PAM50 molecular subtype and metastatic site. % of gene expression variability explained by each PC, and PC1 and PC2 R2 values obtained from simple linear regression models are show.
