
Fig. 6.
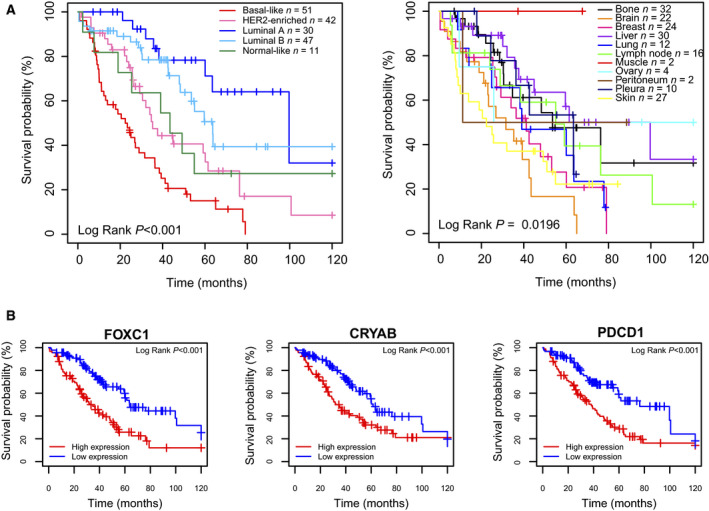
Associations with overall survival. (A) Kaplan–Meier curves of 10‐year OS (log‐rank test) according to PAM50 molecular subtype and metastatic site. (B) Examples genes associated with poor OS, including two organ‐specific genes (FOXC1 and CRYAB) and the immune gene PDCD1. Kaplan–Meier curves of 10‐year OS (log‐rank test) according to median gene expression of the selected genes.