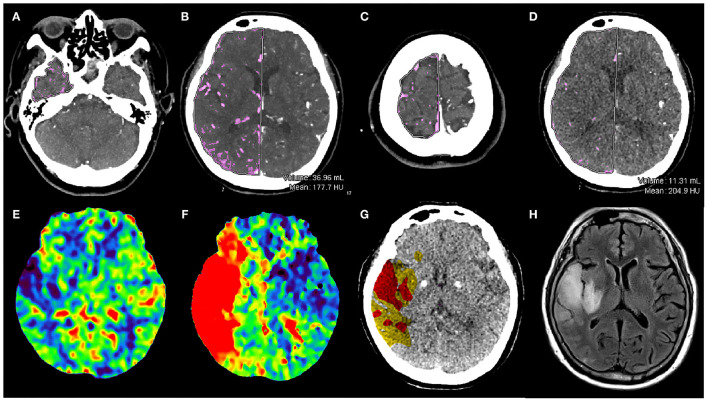
Figure 1.
Illustrative example. Baseline one-stop CTA-CTP images and follow-up MRI in a 78-year-old woman with sudden weakness of the left upper limb. The baseline NIHSS score was 5. First, the layers were drawn manually in the right hemisphere on tMIP CTA: the temporal pole layer (A), the basal ganglia layer (B) and the parietal lobe layer (C) were selected as the initial layer, the intermediate layer and the end layer, respectively. The blood vessel volume calculated automatically by the software, which was 36.96 ml in the right hemisphere. Then, the same methods were used to measure the vascular volume in the left hemisphere (normal side). tMIP CTA VCCq was calculated by the ratio the volume of the affected hemisphere to that of the unaffected hemisphere. The (D) image shows the basal ganglia layer on sCTA, and the same method was used to calculate the volume of blood vessels in the right hemisphere as 11.31 ml. And the ratio the volume of the affected hemisphere to that of the unaffected hemisphere was sCTA VCCq. CBV at the affected hemisphere was decreased in the infarction area (E), TTP was obviously prolonged (F). Tissue map shows an IC area (red) of 50.23 ml and IP area (yellow) of 88.78 ml (G). This patient underwent endovascular treatments and had a FIV of 32.86 mL at T2 Flair (H). The 90-day mRS score for this patient was 0.

