Figure 3.
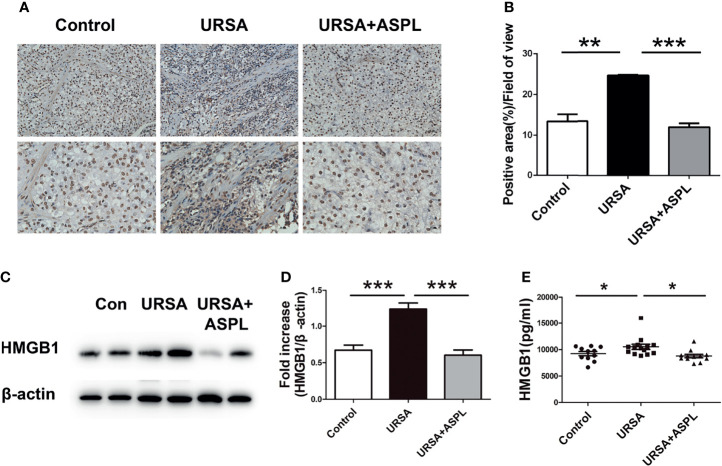
The expression of HMGB1 in mouse decidual tissue. (A) The expression of HMGB1 in mouse decidual tissue was investigated by immunohistochemistry staining. Scale bar represents 50 μm and 20 μm. (n = 6/group). (B) Quantitative assessment of the HMGB1 positive staining area in decidua using ImageJ software. (C) The protein levels of HMGB1 were identified by Western blot analysis. (D) The quantification data analysis of HMGB1 in the mouse decidual tissues. Data were expressed as mean ± SEM. (n = 6/group). (E) The serum HMGB1 levels of mice among control group, URSA group, and URSA+ASPL group were analyzed by ELISA. All the results were representatives of three independent experiments and data were expressed as mean ± SEM. *P < 0.05, **P < 0.01, ***P < 0.001 (Chart D n = 11 in control group; n = 14 in URSA group; n = 11 in URSA+ASPL group).

