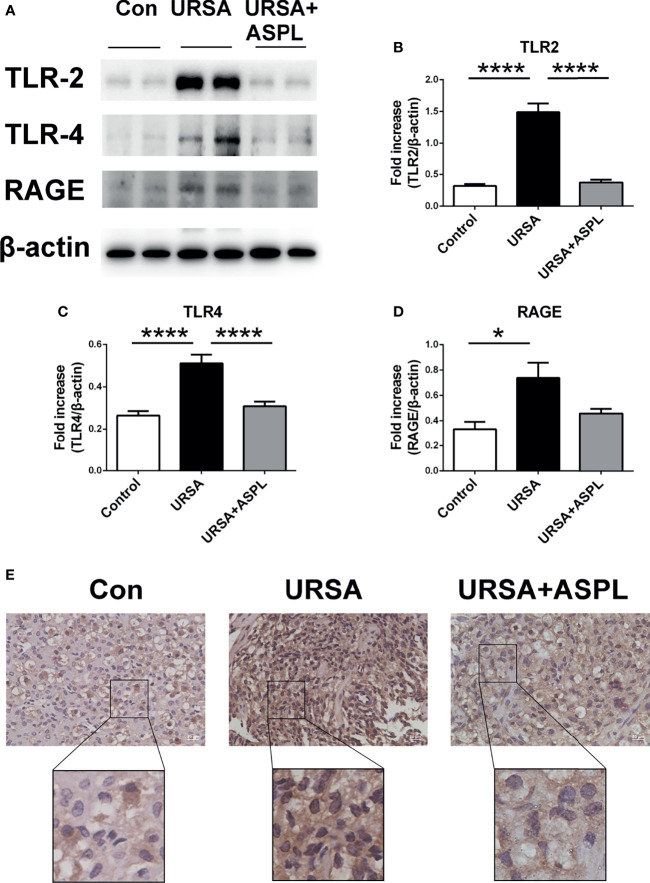
Figure 5.
The analysis of TLR2, TLR4, RAGE, and NF-kB p65 in mouse decidua. (A) The protein levels of TLR2, TLR4, and RAGE were identified by Western blot analysis. (B) Quantitative data analysis for TLR2. (C) Quantitative data analysis for TLR4. (D) Quantitative data analysis for RAGE. (n = 6/group). (E) The expression of NF-κB p65 was detected by immunohistochemistry in decidua among control group, URSA group, and URSA+ASPL group. Scale bar represents 20 μm. (n = 6/group). All the results were representatives of three independent experiments and data were expressed as mean ± SEM. *P < 0.05, ****P < 0.0001.

