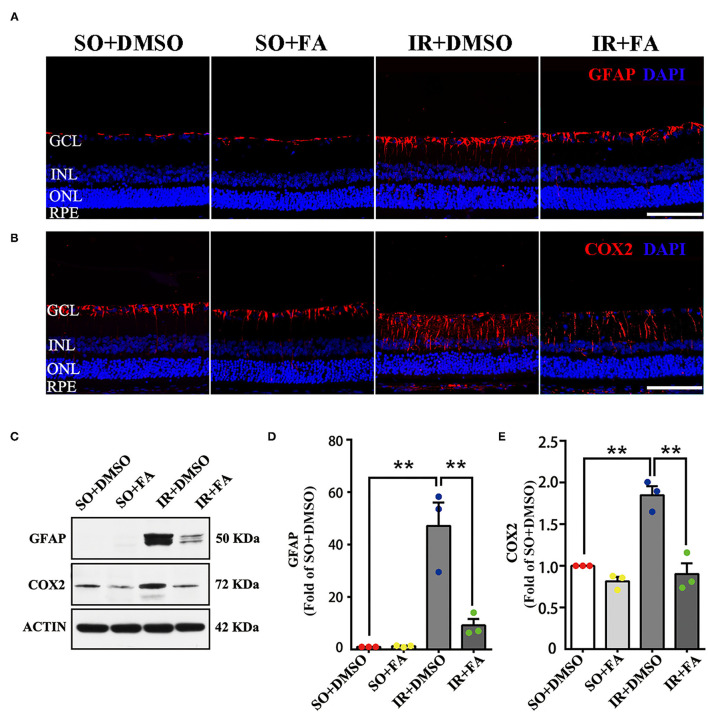
Figure 6.
Activation of PPARα by FA repressed GFAP and COX2 expression in the retinas of IR rats. (A,B) Representative photomicrographs of immunostained GFAP/COX2 (red) and nuclei (blue; counterstained by DAPI) in retinal sections at 24 h post-modeling. (C) Retinal expression of GFAP, COX2, and actin detected by western blotting. (D,E) Average expression of GFAP/COX2 semi-quantified by densitometry and normalized by actin levels in retinas. Data are the mean ± SEM; **p < 0.01. Scale bar = 50 μm.

