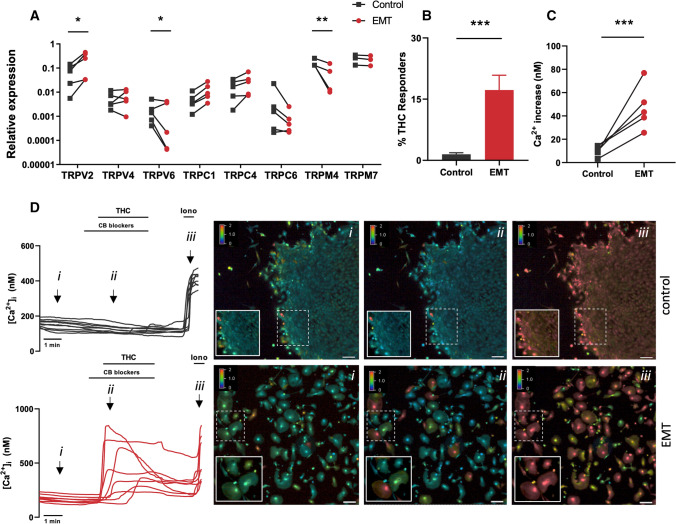
Fig. 2.
TRP channels in EMT: A Quantitative RT-qPCR showing TRP channel mRNA expression (TRPV2, TRPV4, TRPV6, TRPC1, TRPC4, TRPC6, TRPM4 and TRPM7) in control and EMT EEC. Results are shown as relative expression to the geometric mean of housekeeping genes HPRT and PGK. *p < 0.05, **p < 0.01 using two-way ANOVA and Sidak’s multiple comparison test on ΔCT values. N = 3–5 p.s. B Percentage (%) of THC responders in control (n = 1744) vs EMT (n = 1765) EEC. ***p < 0.001 using Fisher’s exact test. N = 5 p.s, n = 14 measurements. Data are represented as mean ± SEM. C Ca2+ amplitude in all cells during THC application, represented as the difference between the peak value and the baseline value. *p < 0.05 using Mann–Whitney test. N = 5 p.s, n = 14 measurements. D Representative Ca2+ traces of THC-induced [Ca2+]i changes in control vs. EMT. Each line represents a single EEC. (i) Representative colour-coded Fura-2 [Ca2+]I ratio images during measurement of EEC indicated in graph D: basal situation (i), after THC application (ii), and after application of ionomycin (iii). Pseudo-colour ratio images were obtained using Nikon software. Scale bar = 100 µm

