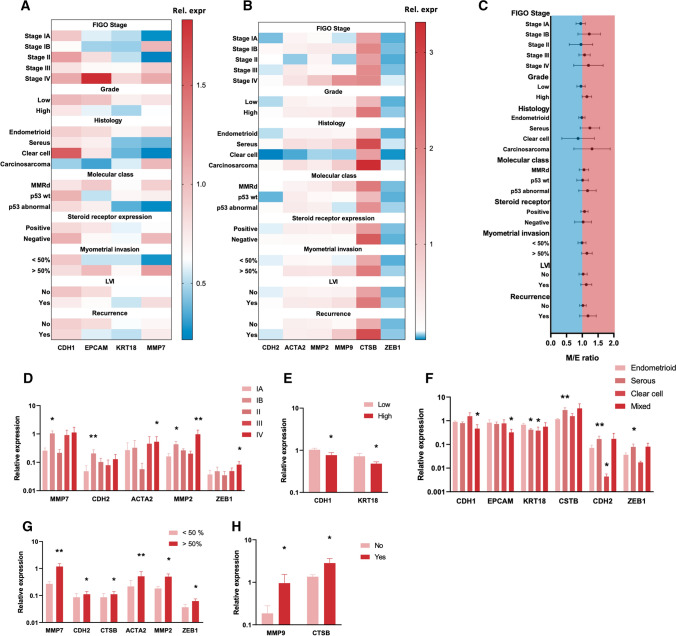
Fig. 5.
Relationship between marker gene expression and clinical parameters: A, B Heat maps of mRNA expression of epithelial (CDH1, KRT18, EPCAM, MMP7) and mesenchymal (MMP2, MMP9, CTSB, ACTA2) markers between different clinical parameters (FIGO stage, grade, histology, molecular class, steroid receptor expression, myometrial invasion, LVI and recurrence) in primary EC biopsies. Results are shown as mean relative expression to the geometric mean of housekeeping genes HPRT, PGK, ACTB and GAPDH. N = 54 p.s. C Mesenchymal/epithelial ratio between different clinical parameters shown as mean ± 95% CI. Colours indicate ratio’s < 1 (blue) and > 1 (red). The ratio was constructed for each biopsy using median expression values. D–H Relative expression of marker genes displaying significant associations with certain clinical parameters: stage (compared to Ia) (D), grade (E), histology (compared to endometrioid) (F), myometrial invasion (G) and recurrence (H). Data are represented as mean ± SEM. *p < 0.05 **p < 0.01 using univariate linear regression with mRNA expression (ΔCT) as dependent variable and clinical parameters as independent variable. N = 54 p.s

