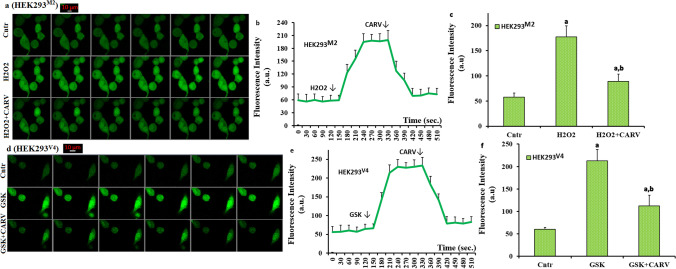
Fig. 4.
The treatment of CARV modulated the increase of cCa2+ concentration via inhibition of TRPM2 and TRPV4 in the HEK293M2 and HEK293V4 cells. (Mean ± STD). The HEK293M2 and HEK293V4 cells in the in the control (Cntr), H2O2, GSK, H2O2+CARV, and GSK+CARV groups were stained with Fluo 3-AM (1 µM for 60 min). After washing the cells, the stained cells were stimulated by by H2O2 (1 mM) or GSK (100 nM), although they were inhibited by CARV (100 µM). Representative confocal microscope (objective: 40x oil) images, mean colon and line values of Cntr, H2O2, and H2O2+CARV groups on the cCa2+ concentration through TRPM2 in the HEK293M2 were shown a, b, and c, respectively. Effects of CARV treatments on the GSK-induced changes of cCa2+ intensity in the HEK293V4 were also shown by images (d), lines (e), and columns (f). The scale bar: 10 μm. One example image of each figure was selected from 20-25 HEK293 of 6 independent experiments for each condition

