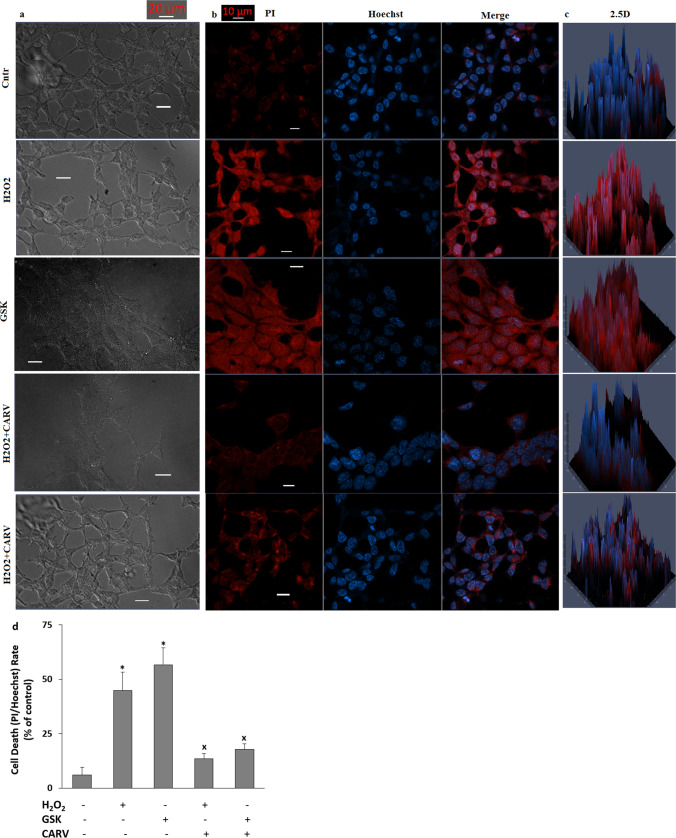
Fig. 8.
The pretreatment of CARV (100 µM for 24 h) modulated GSK (100 nM for 24 h) and H2O2 (1 mM for 24 h)-induced increase of SH-SY5Y cell death. (Mean ± STD and n=20-25). a. The images of bright field (BF, black-white). b. The images of PI (red and dead cells), Hoechst (blue and live cells), and merge images. c. The 2.5 D images of merges. d. The mean percentage of cell death (PI and Hoechst-positive) cell rates in the five groups. (Objective: 20×. Scala bar: 20 μm). (*p ≤ 0.05 vs. control (Cntr) and MLT groups. ×p≤ 0.05 vs. H2O2 and GSK groups)

