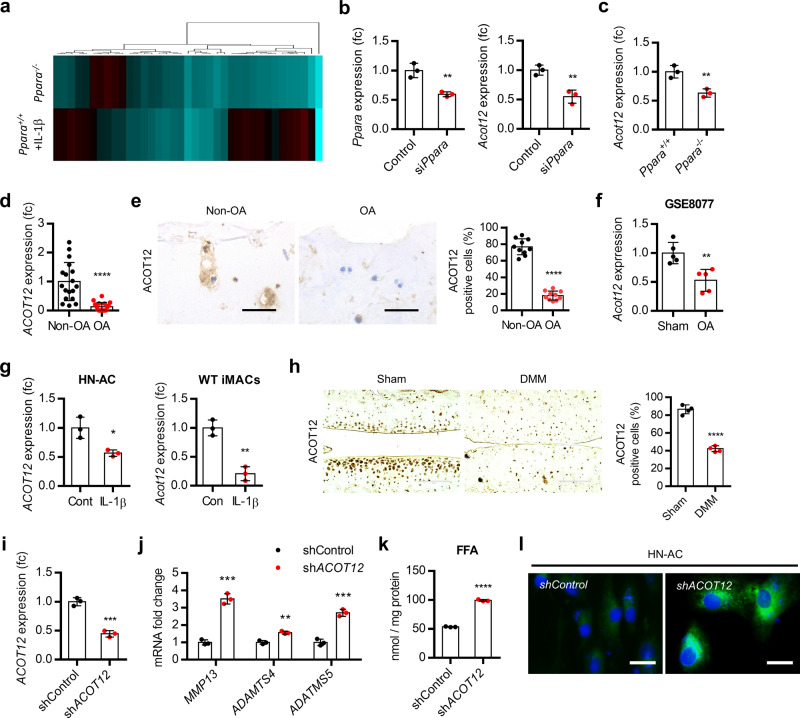
Fig. 3. ACOT12 is a major regulatory factor in OA pathogenesis induced by PPARα deficiency.
a Heatmap analysis of lipid metabolism genes in Ppara+/+ and Ppara−/− iMACs in the presence of IL-1β. Heatmap analysis was performed using a PermutMatrix-1.9.3. b Expression level of Acot12 in iMACs introduce siRNA specific to Ppara (siPpara). Knockdown efficiency of siPpara was confirmed by qRT-PCR (n = 3), P = 0.0056 for Ppara, P = 0.0050 for Acot12. c Expression level of Acot12 in Ppara+/+ and Ppara−/− iMACs (n = 3), P = 0.0077). d Expression level of ACOT12 in non-OA (n = 18) and OA (n = 18) chondrocytes (P < 0.0001). e Immunohistochemistry of ACOT12 in non-OA and OA cartilage (P < 0.0001). Scale bars, 50 μm. f Expression of Acot12 in GSE8077 of rat OA articular chondrocytes (n = 5), P = 0.0041. g Expression level of ACOT12 in HN-AC (n = 3) and WT iMACs (n = 3), P = 0.0170 for HN-AC, P = 0.0017 for WT iMACs. h Immunohistochemistry of ACOT12 in OA-induced mouse cartilage (n = 4), P < 0.0001. Scale bars, 100 μm. i shACOT12 was introduced into HN-AC (n = 3). Knockdown efficiency of shAOCT12 was confirmed by qRT-PCR (n = 3), P = 0.0004. j Expression of Mmp13, Adamts4 and −5 in shACOT12-introduced HN-AC (n = 3), P = 0.0002 for Mmp13, P = 0.0018 for Adamts4; P = 0.0004 for Adamts5. k Cellular level of FFA in shACOT12-introduced HN-AC (n = 3), P < 0.0001. l BODIPY staining in shACOT12-introduced HN-AC cells. Scale bars, 20 μm. Values are means ± SD. Unpaired Student’s t test (b–i, k) or multiple t test followed by Holm–Sidak method (j) were used for statistical analysis. *P < 0.05; **P < 0.01; ***P < 0.001; ****P < 0.0001.

