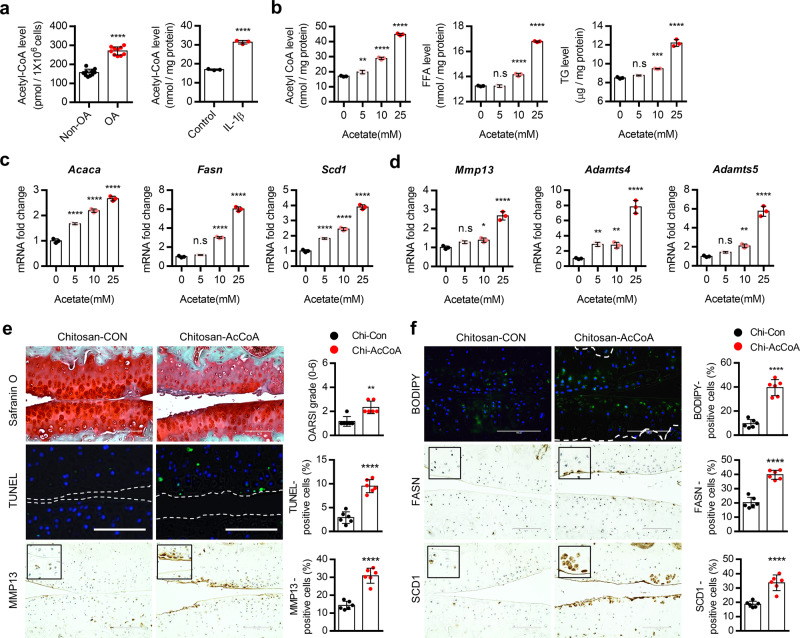
Fig. 6. Acetyl-CoA overload is responsible for stimulation of de novo lipogenesis during OA pathogenesis.
a Cellular level of acetyl-CoA in non-OA (n = 10) and OA (n = 10) chondrocytes (left panel), P < 0.0001, and iMACs-treated w/wo IL-1β (right panel), P < 0.0001. b Cellular level of acetyl-CoA (0 vs. 5 mM acetate, P = 0.0072, 10 mM acetate, P < 0.0001, 25 mM acetate, P < 0.0001) FFA (0 vs. 5 mM acetate, P = 0.9928, 10 mM acetate, P < 0.0001, 25 mM acetate, P < 0.0001), and TG (0 vs. 5 mM acetate, P = 0.2767, 10 mM acetate, P = 0.0006, 25 mM acetate, P < 0.0001) with sodium acetate treatment (n = 3). c Expression level of Acaca (P < 0.0001), Fasn (0 vs. 5 mM acetate, P = 0.3177, 10 mM acetate, P < 0.0001, 25 mM acetate, P < 0.0001 for 25 mM) and Scd1 (P < 0.0001) with sodium acetate treatment (n = 3). d Expression level of Mmp13 (0 vs. 5 mM acetate, P = 0.0819, 10 mM acetate, P = 0.0199, 25 mM acetate, P < 0.0001), Adamts4 (0 vs. 5 mM acetate, P = 0.0038, 10 mM acetate, P = 0.0053, 25 mM acetate, P < 0.0001), and Adamts5 (0 vs. 5 mM acetate, P = 0.2391, 10 mM acetate, P = 0.0045, 25 mM acetate, P < 0.0001) with sodium acetate treatment. e Safranin O staining, TUNEL analysis, and immunohistochemistry of MMP13 in mouse cartilage injected with chitosan (n = 6) or chitosan-AcCoA (n = 6). The degree of cartilage degradation quantified according to OARSI grade (P = 0.0016) and TUNEL- (P < 0.0001) and MMP13-positive cell (P < 0.0001) are indicated by bar–dot plot. Scale bars, 100 μm. f BODIPY staining and immunohistochemistry of FASN and SCD1 in mouse cartilage injected with chitosan or chitosan-AcCoA. Scale bars, 100 μm. BODIPY- (P < 0.0001), FASN- (P < 0.0001), or SCD1-positive cells (P < 0.0001) indicated by bar–dot plot (n = 6). Values are means ± SD. Unpaired Student’s t test (a, e, f) or one-way ANOVA followed by Dunnett’s multiple comparisons test (b–d) were used for statistical analysis. n.s, not significant P >= 0.05; *P < 0.05; **P < 0.01; ***P < 0.001; ****P < 0.0001.

