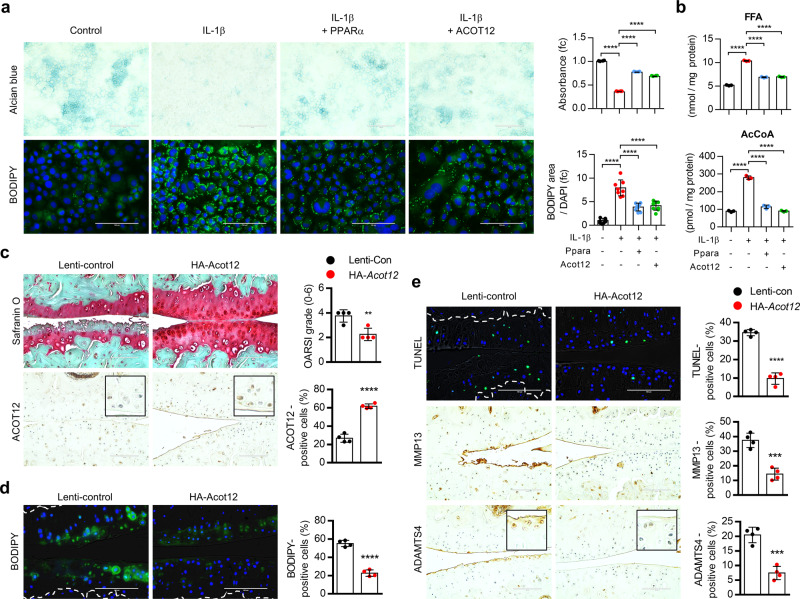
Fig. 7. ACOT12 overexpression alleviates lipid accumulation and OA pathogenesis induced by PPARα deficiency.
a Alcian blue (n = 3) and BODIPY (n = 8) staining of Ppara−/− iMACs introduced by PPARα or ACOT12 expression vector in the absence or presence of IL-1β, P < 0.0001 for Alcian blue, P < 0.0001 for BODIPY. Scale bars, 100 μm. b Cellular level of FFA (P < 0.0001) and acetyl-CoA (P < 0.0001) in Ppara−/− iMACs introduced by PPARα or ACOT12 expression vector in the absence or presence of IL-1β. c Safranin O staining and ACOT12 staining in the cartilage of Ppara−/− mice transfected with lentivirus containing HA-tagged Acot12 (HA-Acot12). Scale bars, 100 μm. OARSI grade (P = 0.0054) and ACOT12-positive cells (P < 0.0001) indicated by bar–dot plot (n = 4). d BODIPY483/503 staining of in cartilage of Ppara−/− mice transfected with HA-ACOT12 (n = 4), P < 0.0001. Subchondral bone indicated with white line. Scale bars, 100 μm. e TUNEL (P < 0.0001)-, MMP13 (P = 0.0004)-, ADAMTS4 (P = 0.0003) staining in cartilage of Ppara−/− mice transfected with HA-ACOT12 (n = 4). Subchondral bone indicated with white line in TUNEL staining. Scale bars, 100 μm. Values are means ± SD. Unpaired Student’s t test or one-way ANOVA (c–e) followed by Tukey’s multiple comparisons test (a, b) were used for statistical analysis. **P < 0.01; ***P < 0.001; ****P < 0.0001.

