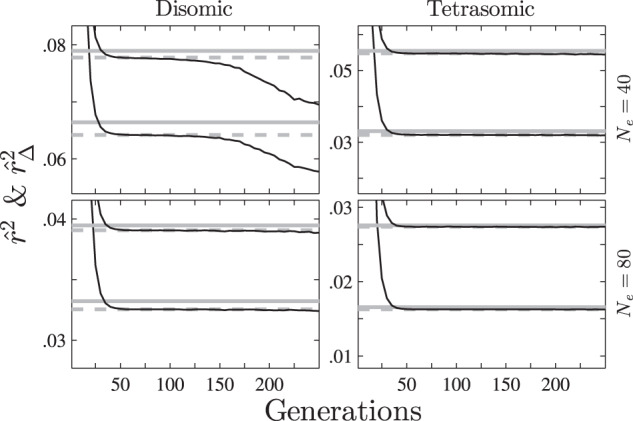
Fig. 1. The behaviors of and during reproduction for the MS mating system (set Ne = 40 or 80, v = 2 or 4, L = 200 and c = 0.1).

Each of the two columns shows the results of a different ploidy level, and each of the two rows shows the results of a different effective population size. Solid gray lines denote approximate d2 or δ2, dotted gray lines denote exact d2 or δ2, and solid lines denote or , where the lines representing δ2 (or ) are above those representing d2 (or ) for each situation.
