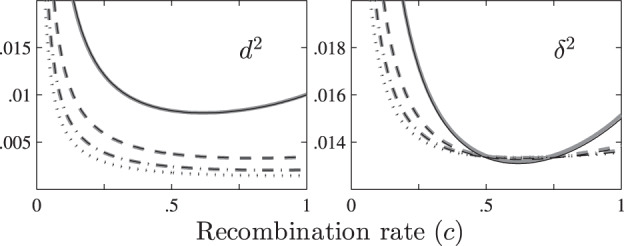
Fig. 2. The relationship between d2 (or δ2) and the recombination frequency c for the MS mating system (set Ne = 100, n = 100 and v = 2, 4, 6 or 8).

The solid, dashed, dash-dotted and dotted lines denote the values for diploids, tetraploids, hexaploids and octoploids in turn, and the gray and the black lines denote the exact and the approximate values, respectively.
