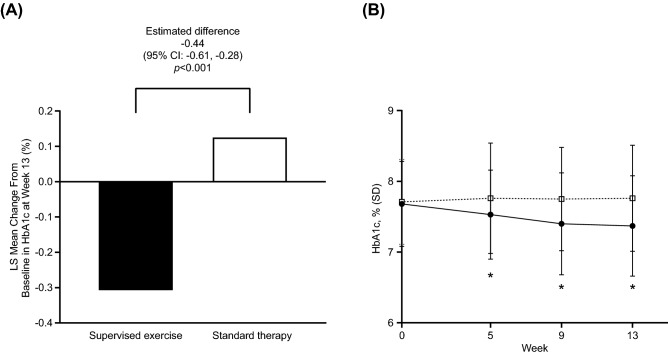
Fig. 2.
a LS mean change from baseline in HbA1c at week 13 and b change over time in HbA1c (FAS). Closed circles = supervised exercise group; open squares = standard therapy group. CI confidence interval; FAS full analysis set; HbA1c hemoglobin A1c; LS least squares; MMRM mixed-model repeated measures; SD standard deviation. *p < 0.001 between groups for the LS mean change from baseline, MMRM with an unstructured covariance matrix within patients. The model considered randomization group (supervised exercise, standard therapy), week, baseline HbA1c, and week-by-randomization group interaction and week-by-baseline interaction as explanatory variables

