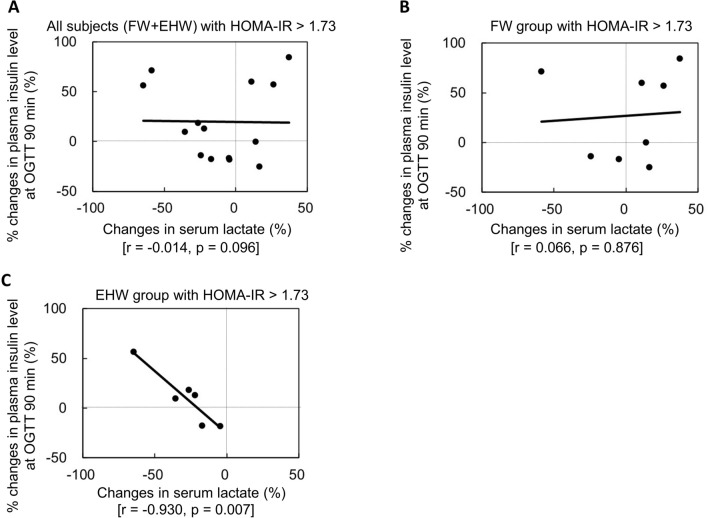
Fig. 3.
Correlation between the changes in the amount (A) and rate (B) of serum lactate concentration and the changes in the amount and rates of insulin values 90 min after 75-g OGTT in the subjects with HOMA-IR > 1.73 in the EHW group. The changes in serum lactate concentration correlated negatively with the changes in insulin values 90 min after the 75-g OGTT. The higher the fasting serum lactate concentration, the higher the increase in insulin secretion after 90 min

