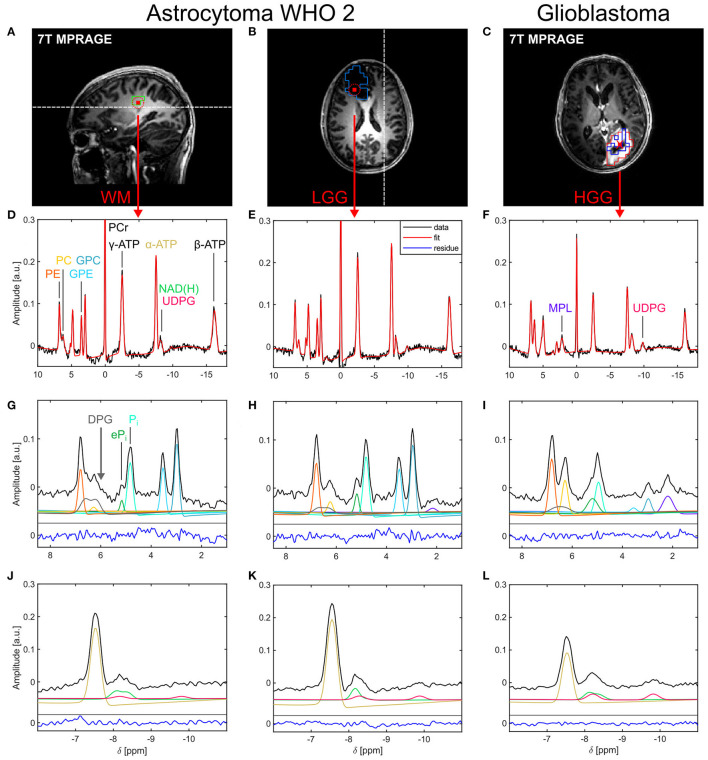
Figure 1.
Representative localized 31P brain spectra and corresponding fits from a patient with a low-grade glioma [astrocytoma WHO 2; healthy tissue: (A,D,G,J); tumor tissue: (B,E,H,K)] and a patient with a high-grade glioma [glioblastoma; tumor tissue only; (C,F,I,L)]. (A–C) Morphological images illustrating voxel positions [red squares in (A,B) indicate the interpolated nominal voxel volume and the red dashed circles the effective spherical voxel volume; red cross in (C)] and representative ROI definitions [green box in (A): WM; light blue box in (B): WTV; red box in (C): GDCE; dark blue box in (C): NEC]. The white dashed lines in (A,B) indicate the slice positions of (B,A), respectively. (D–F) Acquired spectra (black lines) and corresponding fits (red lines) displayed over the full spectral range. Spectral excerpts from 1.0 to 8.5 ppm (G–I) and from −11.0 to −6.0 ppm (J–L) illustrate the individual fitted metabolite signals in these spectral regions (colored lines as indicated by the peak assignments in (D,F,G); shifted on the y-axis for better visualization). The fitting residuals (blue lines) in (G–L) are scaled equally to the data. For visualization purposes, all spectra and fits were corrected for first-order phase with t0 = 1.1 ms.

